top Command in Linux
The top command in Linux displays real-time information about system processes and resource usage. It is commonly used to monitor CPU and memory usage, process states, and system load.
The top command is useful for real-time monitoring of system performance, helping identify resource-hungry processes, system load, and memory or CPU issues for troubleshooting and optimization.
Table of Contents
Here is a comprehensive guide to the options available with the top command in Linux −
Syntax of top Command
The syntax of the top command in Linux is as follows −
top [option…]
In the above syntax, the [option...] field is used to specify one or more options that change the command's output.
top Command Options
The options for the Linux top command are listed below −
| Short Option | Long Option | Description |
|---|---|---|
| -b | --batch | Batch mode; no input accepted, useful for scripting. |
| -c | --cmdline-toggle | Toggle between command lines and program names. |
| -d SECS | --delay=SECS | Set delay between updates; allows fractional seconds. |
| -E | --scale-summary-mem | Set summary memory unit: k, m, g, t, p, e. |
| -e | --scale-task-mem | Set task memory unit: k, m, g, t, p. |
| -H | --threads-show | Display individual threads instead of the process summary. |
| -h | --help | Show help text and exit. |
| -i | --idle-toggle | Toggle showing idle tasks. |
| -n NUMBER | --iterations=NUMBER | Set the number of updates before exit. |
| -O | --list-fields | List available sort fields and exit. |
| -o FIELD | --sort-override=FIELD | Sort by the specific field with an optional direction. |
| -p PIDLIST | --pid=PIDLIST | Monitor only specified process IDs (up to 20). |
| -S | --accum-time-toggle | Toggle cumulative time mode for CPU usage. |
| -s | --secure-mode | Force secure mode even for root. |
| -U USER | --filter-any-user=USER | Show processes for any matching user ID/name. |
| -u USER | --filter-only-euser=USER | Show processes for effective user ID/name only. |
| -V | --version | Show version and exit. |
| -w COLUMNS | --width[=COLUMNS] | Control output width (max 512 columns). |
| -1 | --single-cpu-toggle | Toggle between all CPUs in one line or separately. |
Examples of top Command in Linux
This section discusses how to use the top command in Linux with examples −
Launching the top Command in Interactive Mode
To launch the top command interactive mode, execute the following way −
top
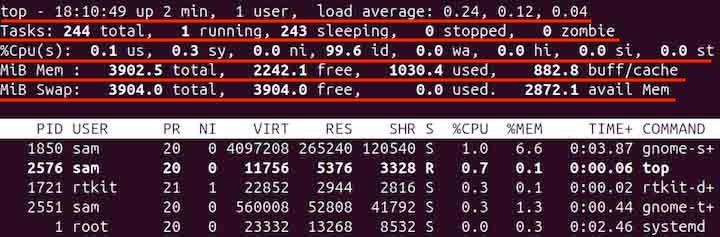
The actions that can be performed in the interactive mode are listed below −
| Key | Description |
|---|---|
| Space | Refresh the screen immediately. |
| d or s | Change the delay between updates (in seconds). |
| l | Toggle display of the load average line. |
| t | Toggle display of task/cpu states. |
| m | Toggle memory information. |
| 1 | Toggle CPU statistics per core. |
| P | Sort by CPU usage. |
| M | Sort by memory usage. |
| T | Sort by time (total CPU time). |
| N | Sort by PID. |
| O | Change sort field interactively. |
| f | Add/remove fields (columns). |
| F | Change which field to sort by. |
| u | Filter by effective user. |
| U | Filter by any user. |
| n | Set number of processes to show. |
| L | Show/hide column names (labels). |
| H | Toggle thread view (show threads instead of processes). |
| k | Kill a process (prompt for PID). |
| r | Renice a process (prompt for PID and nice value). |
| W | Write current settings to ~/.toprc. |
| Z | Change color settings. |
| q | Quit the top command. |
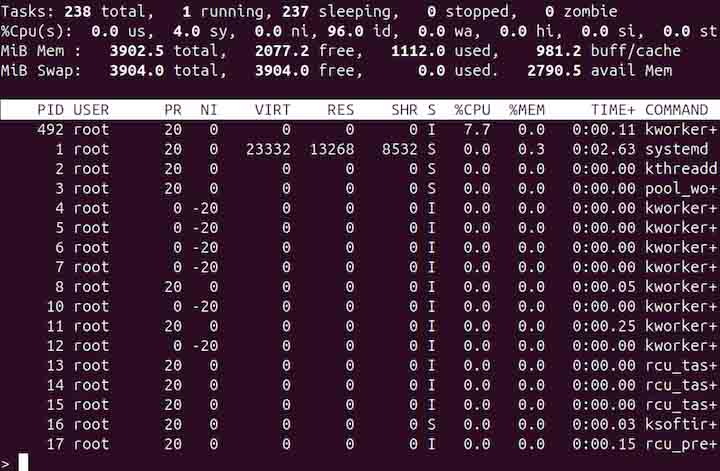
Running the top Command Once and Exiting
To execute the top command and exit, use the -n or --iterations option followed by the number of iterations −
top -n 1
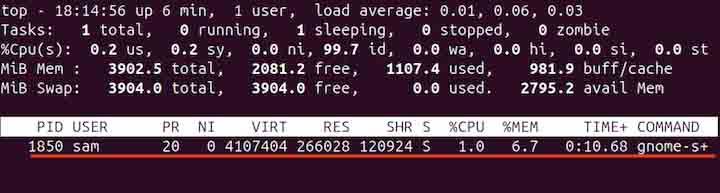
Monitoring a Specific Process
To monitor a specific process, use the -p or --pid option followed by the process ID (PID) −
top -p 1850
Displaying the Processes Owned by a Specific User
To print the processes owned by a specific user, use the -u or --filter-only-euser option followed by the username −
top -u alex
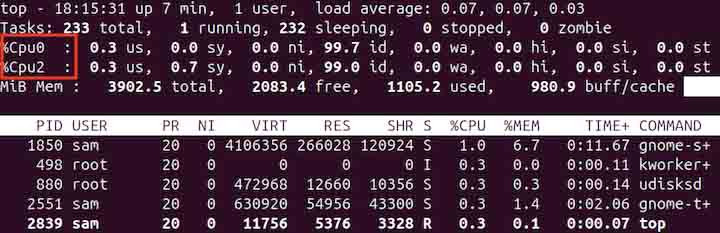
Displaying Each CPU Core Stats
To print stats of each CPU core, use the -1 option −
top -1
Setting the Update Delay
To set the update delay, use the -d or --delay option followed by the number of seconds −
top -d 2
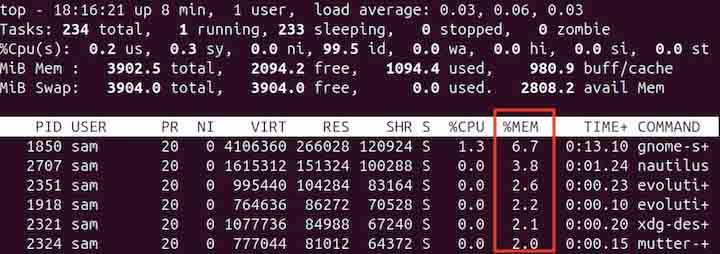
Sorting the Output
To sort the output by a specific field, use the -o or --sort-override option followed by the field −
top -o %MEM
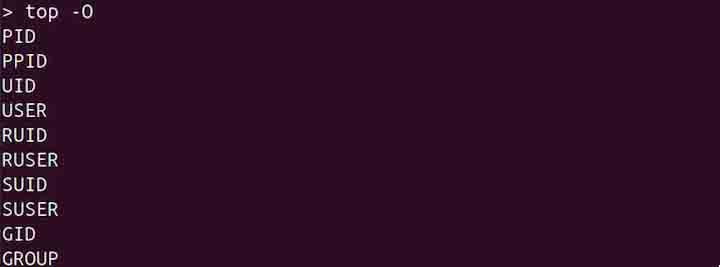
To display the sort fields, use the -O or --list-fields options −
top -O
Displaying All Threads
To show all threads instead of summarizing per process, use the -H or --threads-show option −
top -H
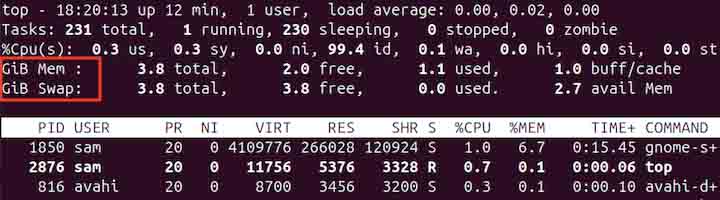
Setting the Memory Unit
To set the memory unit, use the -E or --scale-summary-mem option with the top command −
top -E
Displaying Usage Help
To display the usage help of the top command, use the -h or --help option −
top -h
Conclusion
The top command in Linux is a powerful tool for monitoring system performance in real time. It provides detailed information about running processes, CPU and memory usage, and system load.
With various options available, the top command allows customization of output, filtering by users or processes, and sorting based on specific fields. This command is essential for diagnosing system issues, managing processes, and optimizing resource usage effectively.
