ltrace command in Linux
In Linux, developers and system administrators often debug and troubleshoot system issues by observing the behavior of running programs.
The ltrace command is a powerful command line tool that helps trace the library calls a program makes during execution. It shows how a program interacts with its shared libraries, helping identify errors, monitor performance, and understand how the program works internally.
Table of Contents
Here is a comprehensive guide to the options available with the ltrace command −
- What is ltrace Command in Linux?
- Syntax of ltrace Command
- ltrace Command Options
- Installation of ltrace Command
- How to Use ltrace Command in Linux?
- Examples of ltrace Command in Linux
What is ltrace command in Linux?
ltrace is a command-line tool in Linux that lets you track and log the library calls a program makes. These are the functions from shared libraries (like libc, libm, etc.) that the program uses for tasks like file handling, math operations, or networking. You can observe these calls to better understand how the program interacts with system resources.
ltrace Vs. Strace
Strace tracks system calls, while ltrace focuses on library calls. The ltrace command is used for debugging programs that depend on shared libraries, while strace is used for observing interactions with the OS kernel. strace shows low-level system interactions, helping to spot OS or permission issues while ltrace focuses on higher-level behavior by tracking library calls.
Syntax of ltrace command
To use ltrace command in Linux, you must execute the following syntax −
ltrace [options] command [args]
Here, "args" represent arguments to pass to the command (if any), and "options" are the optional flags that modify how ltrace behaves.
ltrace command Options
The ltrace command can accept several optional flags, some of them are listed below −
- -h, --help − It returns the help page for the ltrace command and exit.
- -v, --verbose − It shows a detailed output, which includes the return values of the library calls.
- -p, --pid <pid> − It attaches ltrace to a running process with the specified PID instead of starting a new process.
- -c, --count − It shows the count of library calls made during execution.
- -f, --follow-forks − It traces child processes if the traced process forks.
- -e, --entry <function> − It filters and traces specific functions in the libraries.
- -o, --output <file> − It writes the trace output to a file instead of a terminal.
Installation of ltrace Command
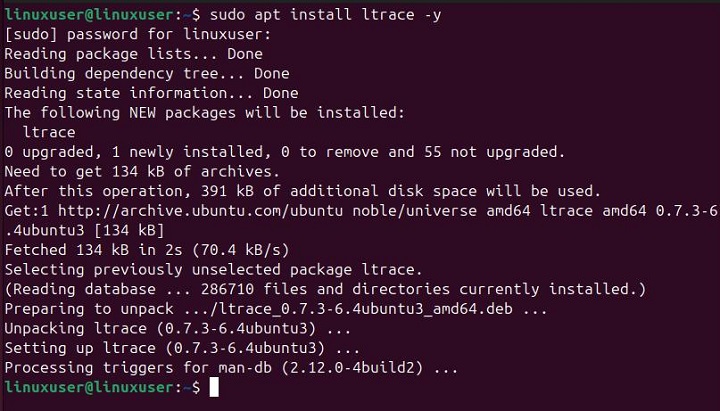
The ltrace command is not preinstalled on Linux, however, you can install it on Debian-based systems with the following command −
sudo apt install ltrace -y
Fedora users can execute the following command to install ltrace on their systems −
sudo dnf install ltrace
The users having CentOS/RHEL-based systems can use the yum package manager to install ltrace on their systems −
sudo yum install ltrace
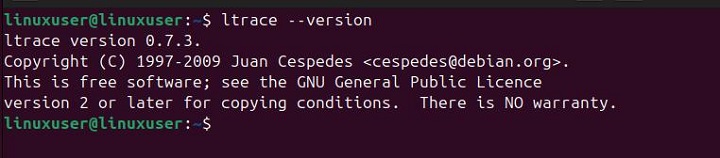
Once ltrace is installed, run the following command to confirm its installation −
ltrace --version
The output below verifies the successful installation of ltrace command on Linux −
How to Use ltrace Command in Linux?
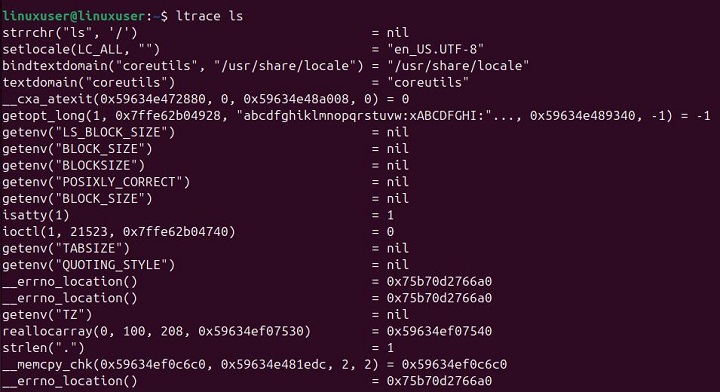
You can use the ltrace command with or without additional options. The simplest way to use ltrace is to use it with the command you want to trace. For instance, the following command traces the library calls made by the ls command −
ltrace ls
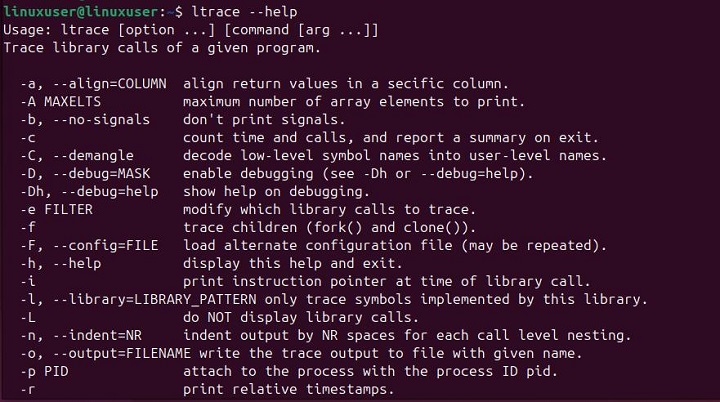
Run the following command to learn more about the usage of the ltrace command −
ltrace --help
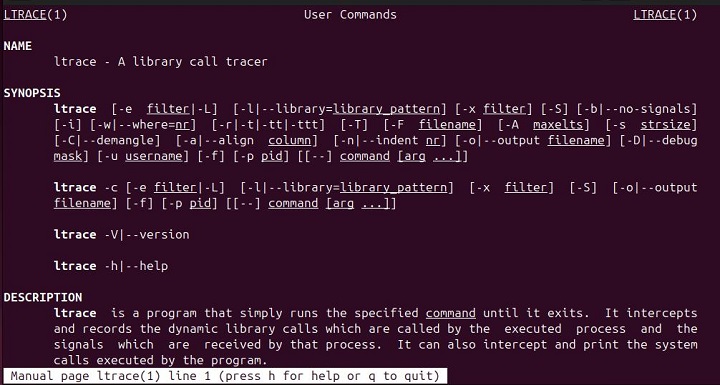
To get more detailed help, you can access the manual page of the ltrace command, as follows −
man ltrace
Examples of ltrace Command in Linux
Let's go through the following examples to get a better understanding of the Linux ltrace command −
Tracing echo Command with ltrace
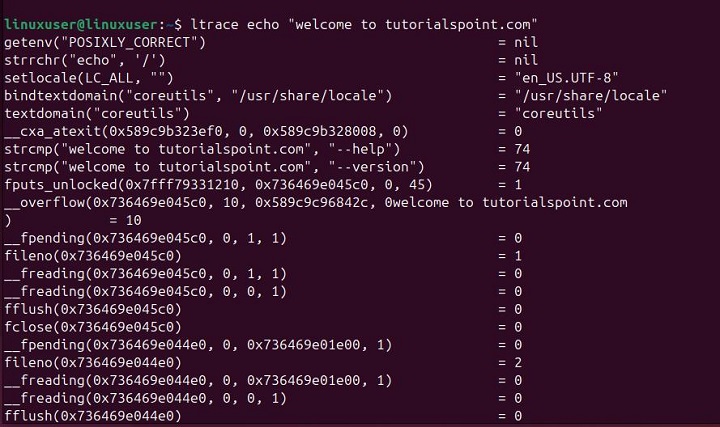
The following example shows how to trace echo command with the ltrace command −
ltrace echo "Welcome to tutorialspoint.com!"
Tracing a Command with Arguments Using ltrace
We can use the ltrace command to trace any specific command with arguments. For instance, the following command traces the gcc compiler with arguments −
ltrace gcc -o output_file source_code.c
The above command will show the library calls made by the gcc command while compiling source_code.c into output_file.
Attaching ltrace to a Running Process
We can run the ltrace command with the -p option to attach it to a running process −
ltrace -p PID
Replace PID with the actual process ID of the running process.
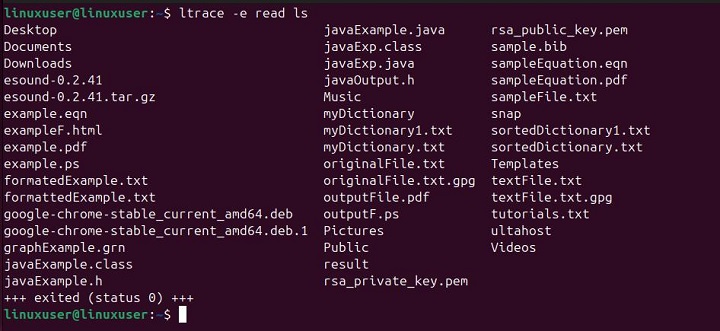
Filtering Specific Library Calls with ltrace
We can run the ltrace command with the -e option to filter specific library calls. For instance the following command uses the -e option to display only the read library calls made by the ls command −
ltrace -e read ls
Tracing a C Program with Arguments
Let's create a C program that uses the malloc and free functions to allocate and free memory −
#include <stdlib.h>
#include <stdio.h>

int main() {
	char *str = (char *)malloc(50 * sizeof(char));
	if (str == NULL) {
		perror("malloc failed");
		return 1;
	}
	free(str);
	return 0;
}
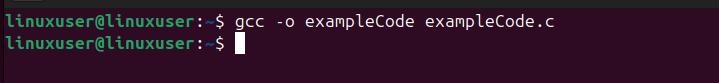
Let's compile this code with gcc −
gcc -o exampleCode exampleCode.c
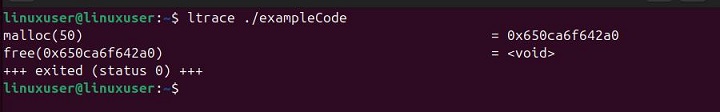
After compiling this program, run the following command to trace it to see the library calls −
ltrace ./exampleCode
Tracing Parent and Child Processes with ltrace
If a program creates child processes using fork, you can trace both the parent and child processes using the ltrace command with the -f option −
ltrace -f ./fork_proc
This command will trace both the parent and child processes created by the fork_proc program.
Conclusion
ltrace is a useful command-line tool in Linux for developers and system administrators. It helps us track and fix issues by showing the library calls a program makes. By observing how a program uses shared libraries, ltrace can help find errors and improve performance. It also gives a better understanding of how the program works.
In this tutorial, we explained how to use ltrace for different tasks. These include tracking specific functions, filtering library calls, attaching to running processes, and monitoring both parent and child processes.
