strace Command in Linux
The Linux strace command is a handy command that provides you with an understanding of how programs interact with the operating system. It follows and prints system calls, the calls programs issue to the kernel. This could be reading files, accessing memory, or accessing hardware. By showing you this, strace helps you to find and fix errors, learn about programs, or see performance problems more easily. This is primarily helpful for developers and system administrators trying to figure out why a program is not behaving as it should.
Table of Contents
Here is a comprehensive guide to the options available with the strace command −
- What Does strace Command Do?
- Installing strace Command
- Syntax of strace Command
- strace Command Options
- Examples of strace Command in Linux
What Does strace Command Do?
System calls are like a bridge between a program and the Linux kernel. When you open a file, the program makes a system call to the kernel to read it. The tool strace captures these system calls and shows you exactly what the program is doing.
This is useful for several reasons −
- It helps in finding problems in programs.
- You can see which files a program is trying to use.
- It shows how a program is using system resources.
- You can find out why a program might be stuck or running slowly.
Installing strace Command
To start using strace, you'll need to ensure it's installed on your system. Follow the steps below based on your Linux distribution −
Ubuntu / Debian −
sudo apt install strace
CentOS / RHEL −
sudo yum install strace
Arch Linux −
sudo pacman -S strace
Syntax of strace Command
The basic syntax of the strace command is −
strace [OPTIONS] COMMAND [ARGS]
- OPTIONS − These are flags that modify the behavior or output of strace.
- COMMAND − The program or script you want to trace.
- ARGS − Any arguments required by the program.
strace Command Options
Here are some of the most frequently used options in strace −
| Option | Description |
|---|---|
| -e EXPR | Allows you to filter specific types of system calls by setting a condition or criteria (e.g., trace file operations or signals only). |
| -p PID, --attach=PID | Attaches strace to a running process with a given process ID (PID). |
| -E VAR=VAL, --env=VAR=VAL | Adds a custom variable to the environment for the program you are tracing. |
| -u USERNAME, --user=USERNAME | Executes the command as the specified user (USERNAME), handling permissions like setuid and setgid. |
| --argv0=NAME | Changes the argv[0] value for the program being executed, effectively altering how the program identifies itself. |
| -b execve, --detach-on=execve | Automatically detaches strace when a program executes another program via the execve system call. |
| -D, --daemonize[=grandchild] | Runs strace as a daemon in the background instead of being attached to the terminal. |
| -e trace=[!]VAL, --trace=[!]VAL | Allows you to trace only specific system calls (e.g., file operations, signals, memory operations). |
| -e signal=SET, --signal=SET | Traces and prints only system calls related to the specified signal set (e.g., SIGINT, SIGTERM). |
| -P PATH, --trace-path=PATH | Tracks system calls that access a specific file path. Ideal for debugging file access errors. |
| -z, --successful-only | Displays only system calls that successfully execute without errors, excluding failed ones from the output. |
| -Z, --failed-only | Displays only system calls that return error codes, helping you debug failing operations. |
| -o FILE, --output=FILE | Redirects the strace output to a file instead of the terminal. |
| -T, --syscall-times[=PRECISION] | Prints the amount of time each system call takes. |
Examples of strace Command in Linux
Let's explore a few practical examples of the strace command in Linux environment −
- Tracing System Calls of a Program
- Debugging a Running Process
- Filtering Specific System Calls
- Saving Trace Output for Later
- Profiling System Call Performance
- Generating System Call Usage Statistics
Tracing System Calls of a Program
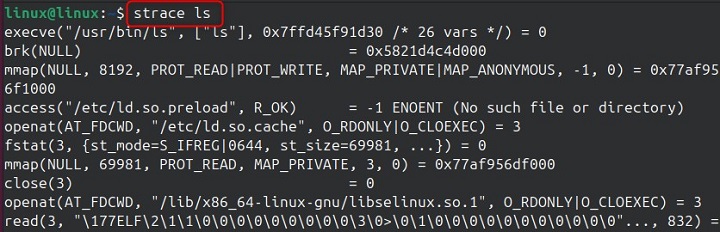
One of the simplest ways to use strace is to trace the system calls made by a program. For instance −
strace ls
This command traces the execution of ls and outputs details such as files opened, directories accessed, and memory allocated during its run.
Debugging a Running Process
When dealing with a running program that’s behaving unexpectedly, you can use strace to observe its system calls without restarting it. To do this, find the program’s process ID (PID) and run −
strace -p 1234
Replace 1234 with the actual PID of the program. This helps identify issues in real time.
Filtering Specific System Calls
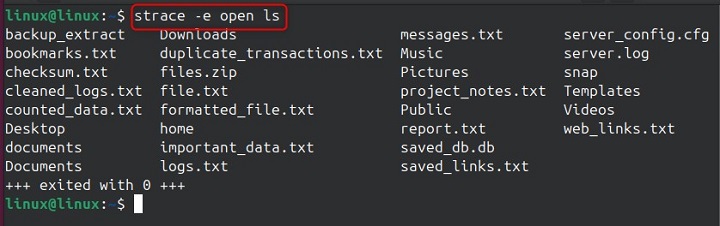
If you’re interested in particular system calls, such as file operations (open), you can filter the output to focus on these calls. For example −
strace -e open ls
This command displays only the open system calls made by ls, making it easier to troubleshoot file-related issues.
Saving Trace Output for Later
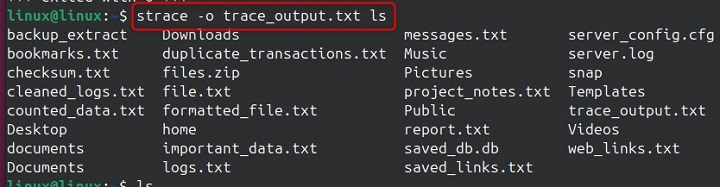
In scenarios where the output from strace is extensive, it’s better to save it to a file for later analysis −
strace -o trace_output.txt ls
This writes the trace logs to trace_output.txt, allowing you to inspect the results in detail.
Profiling System Call Performance
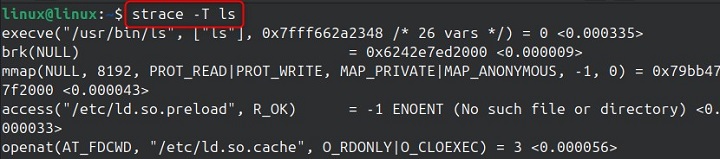
To measure how long each system call takes during program execution −
strace -T ls
The command adds timing information to each system call in the output, helping identify operations that are consuming the most time.
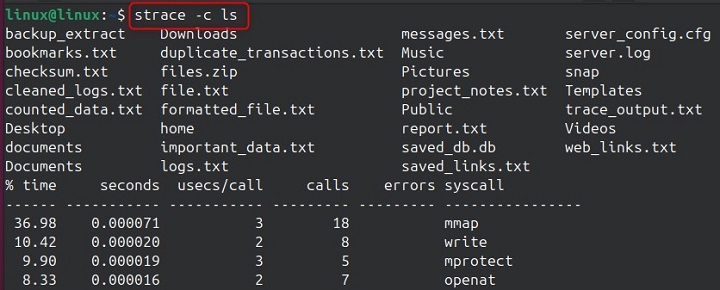
Generating System Call Usage Statistics
If you need an overview of how many times different system calls were used and their total execution time, use the following command −
strace -c ls
This generates a summary that is useful for profiling and performance analysis.
Conclusion
The strace command is a valuable tool for anyone working with Linux systems who needs to debug programs, troubleshoot errors, or optimize performance. By intercepting and recording system calls, strace provides a transparent view into the interactions between a program and the operating system. From tracing program execution and monitoring running processes to filtering specific calls and analyzing performance bottlenecks, strace equips users with the insights needed to solve complex problems.
With its simple installation and versatile options, strace can be used for a wide range of applications. By mastering this tool, you’ll not only improve your ability to diagnose issues but also gain a deeper understanding of how Linux systems work under the hood.
