tload Command in Linux
The tload command in Linux prints the current system load in the form of a graph. It displays a graph of the current system load average on the specified terminal (TTY). If no terminal is specified, it defaults to the terminal where the tload process is running.
Table of Contents
Here is a comprehensive guide to the options available with the tload command −
Syntax of tload Command
The syntax of the tload command in Linux is as follows −
tload [options] [tty]
In the above syntax, the [options] argument is used to specify the options to change the command’s output. The [tty] argument is optional to specify the terminal where the graph should be displayed.
tload Command Options
The options of the tload command are listed below −
| Short Option | Long Option | Description |
|---|---|---|
| -s number | --scale number | Sets vertical scale (characters per tick) |
| -d seconds | --delay seconds | Sets the graph update interval |
| -h | --help | Displays help information |
| -V | --version | Displays version info |
Examples of tload Command in Linux
This section explains how to use the tload command in Linux with examples −
- Displaying System Load Graph in the Current Terminal
- Displaying System Load Graph in a Specific Terminal
- Updating the Graph after a Specific Delay
- Setting Vertical Scale
- Combining Delay and Scale
- Printing Usage Help
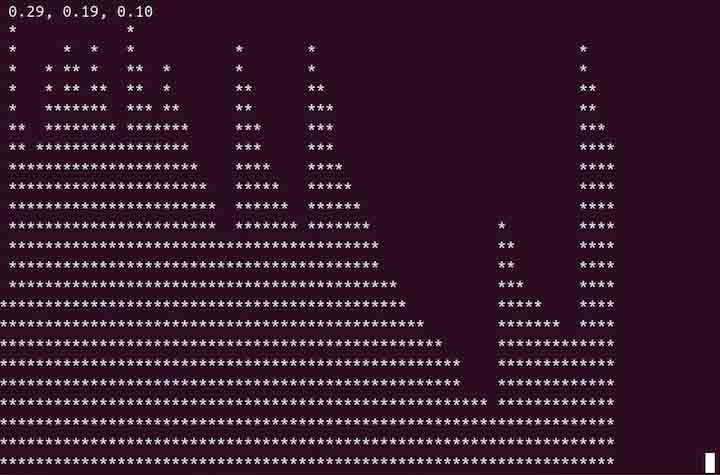
Displaying System Load Graph in the Current Terminal
To print the system load graph in the current terminal, run the tload command −
tload
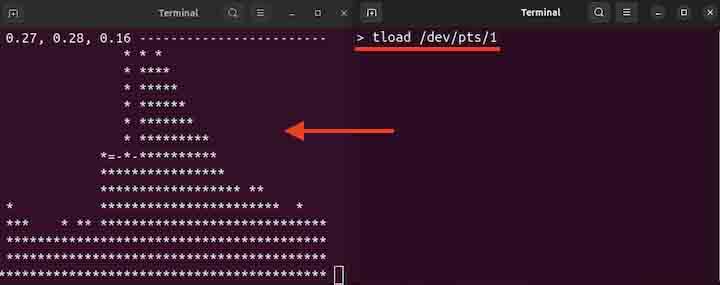
Displaying System Load Graph in a Specific Terminal
To display the graph in a specific terminal, use the tload command followed by the terminal name −
tload /dev/pts/1
To find the current tty, use the following command −
tty
Updating the Graph after a Specific Delay
To update the graph after a specific delay, use the -d or --delay option followed by a number of seconds. For example, to update the graph after every 5 seconds −
tload -d 5
Setting Vertical Scale
To set the vertical scale or characters per tick, use the -s or --scale option followed by a number.
tload -s 1
In the about command, -s 1 means 1 minute per character. The smaller values produce a larger, more stretched graph, while larger values result in a more compressed graph.
Combining Delay and Scale
To combine delay and scale, use both -d/--delay and -s/--scale options −
tload -d 5 -s 1
Printing Usage Help
To print the usage help for the tload command, use the -h or --help option −
tload -h
Conclusion
The tload command in Linux provides a simple way to monitor system load using a graphical display in the terminal. It shows the load average over time and can be customized with options to set the update delay and vertical scale of the graph.
In this brief tutorial, we covered the tload command, its syntax, options, and usage in Linux with examples.
