gdbtui Command in Linux
gdbtui is a Linux command that provides a Text User Interface (TUI) for GDB, the GNU Debugger. It allows you to debug programs with a visual interface in the terminal. It makes it easier for you to see your source code, assembly output, and other debugging information all at once. You can enable TUI mode by starting GDB with the gdb -tui command or by pressing the CTRL+X button followed by A while in GDB.
The gdbtui command is pretty useful for debugging complex programs since with the help of it, you will get a clear view of the programs execution.
Table of Contents
Here is a comprehensive guide to the options available with the gdbtui command in linux −
Syntax for gdbtui Command
The basic syntax to use the gdbtui command on Linux is as follows −
gdbtui [options] [executable-file [core-file or process-id]]
Where,
- [options] are various options you can pass to customize the behavior of GDB.
- [executable-file] is the program you want to debug.
- [core-file or process-id] is optional that specifies a core dump file or a process ID to attach to.
gdbtui Command Options
The gdbtui command offers a variety of options to customize your debugging experience. Below is a list of these options along with their descriptions −
| Option | Description |
|---|---|
| --args | Transfers arguments to the program under debugging. |
| --core=COREFILE | Analyzes the core dump in COREFILE. |
| --exec=EXECFILE | Employs EXECFILE as the executable. |
| --pid=PID | Connects to a running process using the specified PID. |
| --directory=DIR | Looks for source files in the directory DIR. |
| --se=FILE | Designates FILE as the symbol and executable file. |
| --symbols=SYMFILE | Load symbols from SYMFILE |
| --readnow | Read all symbol files immediately. |
| --readnever | Avoid reading symbol files. |
| --write | Allow writing to core and executable files. |
| --command=FILE, -x | Run GDB commands from FILE. |
| --init-command=FILE | Similar to -x, but run commands before loading the program. |
| --eval-command=COMMAND | Run a single GDB command; can be used multiple times. |
| --init-eval-command | Like --eval-command, but before loading the program. |
| --nh | Do not read the ~/.gdbinit file |
| --nx | Do not read any .gdbinit files. |
| --full-name | Produce information for the Emacs-GDB interface. |
| --tty=TTY | Utilize TTY for the debugged programs input/output. |
| -w | Use the GUI interface. |
| --tui | Use the terminal interface. |
| -q, --quiet, --silent | Suppress the version number display on startup. |
| --batch | Exit after processing options. |
| --batch-silent | Similar to --batch, but suppresses all GDB stdout output. |
| --return-child-result | The exit code of the GDB will be the childs exit code. |
| --configuration | Print GDB configuration details and exit. |
| --help | Print help message and exit. |
| --version | Print version information. |
Examples of gdbtui Command in Linux
Lets discuss a few examples of gdbtui commands in Linux systems. This will help you in learning how to get started with the command.
- Start Debugging in TUI Mode
- Attach to a Running Process
- Execute Commands from a File
- Debug Using a Core Dump
- Load Symbols from a File
Start Debugging in TUI Mode
To start debugging in TUI mode, you can simply use the gdbtui command with the name of the program you want to debug. For example −
gdbtui program
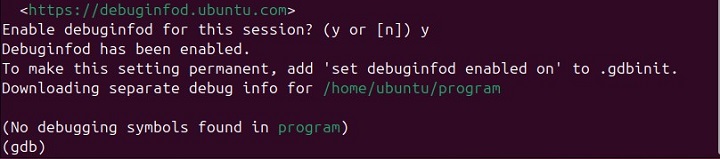
When you execute the command, it will open the debugging session in TUI mode −
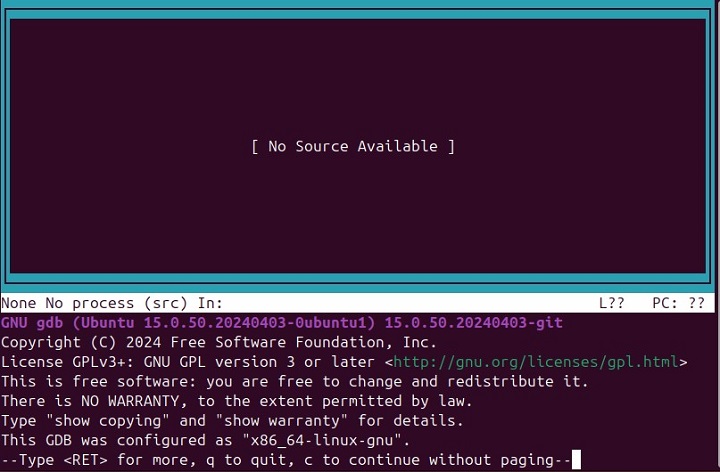
You can enter c to continue and y to run the debugging process −
Attach to a Running Process
To attach to a running process with a specific process ID (PID), you can use the -p option −
gdbtui -p 1234
Replace 1234 with the actual process ID (PID) of the running process you want to debug. This command attaches to the process with PID 1234 and opens the debugging session in TUI mode.
Note: You might need to run the gdbtui command with sudo privileges to complete this process.
Execute Commands from a File
You can also execute gdb commands from a file while debugging a program using the -x option. For example −
gdbtui -x commands.txt program
Replace commands.txt with the actual name of your file containing GDB commands. The above command will run the commands listed in commands.txt while debugging the program.
Debug Using a Core Dump File
To debug a program using a core dump file, you can use the --core option −
gdbtui --core=corefile program
Replace corefile with the actual name of your core dump file. The above command will open the core dump file corefile for the program named as program.
Load Symbols from a File
You can also load symbols from a specific file while debugging a program, it can be done using the --symbols option −
gdbtui --symbols=symbols.sym program
Replace symbols.sym with the actual name of your symbols file. Once you execute the command, it will load symbols from symbols.sym file while debugging the program.
Conclusion
The gdbtui is a powerful command that is used to debug programs with a visual interface in the terminal. You can use this command to start debugging in TUI mode, attach to a running process, execute commands from a file and others.
In this tutorial, we have provided you with the syntax of the gdbtui command along with a description of several options you can use with the command. Additionally, a few examples are executed on Linux systems to guide you with its usage on the systems. These sections will help you understand how to effectively use gdbtui to debug your programs, or customize your debugging experience with various options.
