slabtop Command in Linux
slabtop is a real-time kernel slab memory usage monitoring tool. The slab allocator is a memory management mechanism in the Linux kernel that manages memory caches and provides efficient memory allocation and deallocation. slabtop displays detailed information about the slab cache, including the number of objects, active objects, memory usage, and more.
Table of Contents
Here is a comprehensive guide to the options available with the slabtop command −
- Understanding the slabtop Command
- Installing of slabtop Command
- How to Use slabtop Command in Linux?
- Syntax of slabtop Command
- Examples of slabtop Command in Linux
Understanding the slabtop Command
The slabtop command in Linux provides a real-time, dynamic view of the kernel's slab cache. This cache is a memory management mechanism that efficiently allocates and deallocates kernel objects, reducing fragmentation and improving performance. slabtop displays information about the various slab caches, including their size, number of objects, and cache utilization.
This allows system administrators and developers to identify memory bottlenecks, monitor kernel memory usage, and diagnose potential memory leaks or inefficiencies related to slab allocation. By observing the top consumers of slab memory, one can gain valuable insights into the kernel's memory behavior and optimize system performance.
Installing of slabtop Command
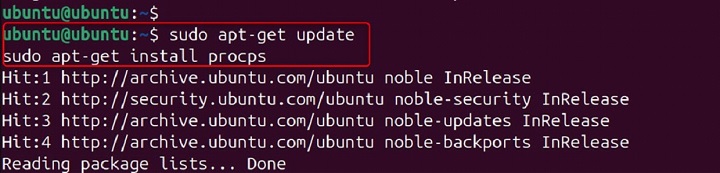
Before you can use slabtop, you need to have it installed. On most Linux distributions, it is part of the procps-ng package, which is usually installed by default. If it's not already installed, you can install it using your package manager. For example −
On Ubuntu / Debian −
sudo apt-get update
sudo apt-get install procps
On CentOS / RHEL −
sudo yum install procps-ng
How to Use slabtop Command in Linux?
slabtop offers interactive features and customizable views to delve deeper into kernel memory usage. Users can sort the output by various columns, such as cache size, object count, or cache utilization, to quickly identify areas of interest. Filtering options allow focusing on specific slab caches, and the refresh interval can be adjusted to monitor changes in real-time.
This dynamic and detailed presentation of slab cache statistics makes slabtop an invaluable tool for system administrators and kernel developers seeking to understand and optimize kernel memory behavior.
Syntax of slabtop Command
The basic syntax for using slabtop is −
slabtop [options]
Examples of slabtop Command in Linux
- Running slabtop with Default Settings
- Sorting by Cache Size
- Changing the Refresh Interval to 5 Seconds
- Displaying the Top 10 Entries
- Running slabtop in Batch Mode
- Filtering by Slab Cache Name
- Displaying the Version of slabtop
- Combining Multiple Options
- Monitoring slabtop Output for 1 Minute
- Redirecting slabtop Output to a File
Running slabtop with Default Settings
To run slabtop with default settings, simply execute the command without any options −
sudo slabtop
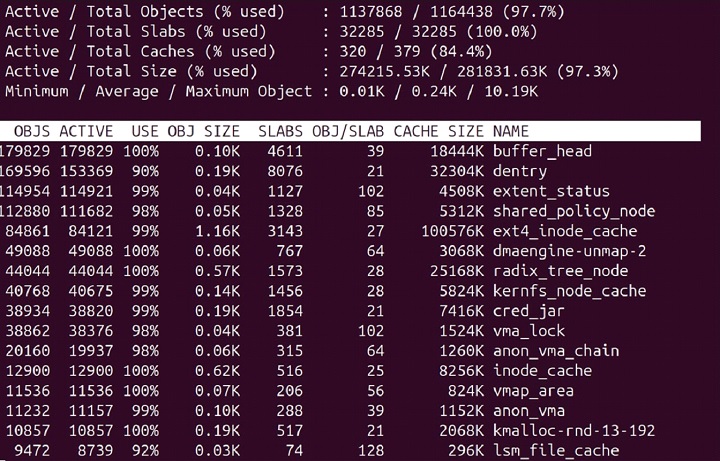
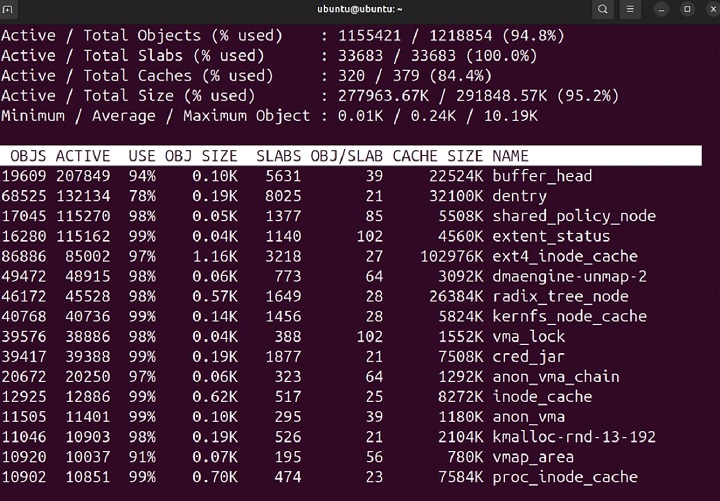
This will display a real-time view of the slab cache usage, refreshing every few seconds.
Understanding the Output
The output of slabtop consists of several columns that provide detailed information about the slab caches. Here's a brief explanation of each column −
Active / Total − The number of active objects and the total number of objects.
- OBJ SIZE − The size of each object in the cache.
- USE − The percentage of the cache in use.
- SLABS − The number of slab caches.
- OBJ / SLAB − The number of objects per slab.
- CACHE SIZE − The total size of the cache.
- NAME − The name of the slab cache.
Sorting the Output
You can sort the output of slabtop based on different criteria using the following options −
- -s a − Sort by the number of active objects.
- -s b − Sort by the number of objects.
- -s c − Sort by cache size.
- -s l − Sort by the number of slabs.
- -s v − Sort by the number of objects per slab.
- -s o − Sort by the object size.
- -s u − Sort by the cache utilization.
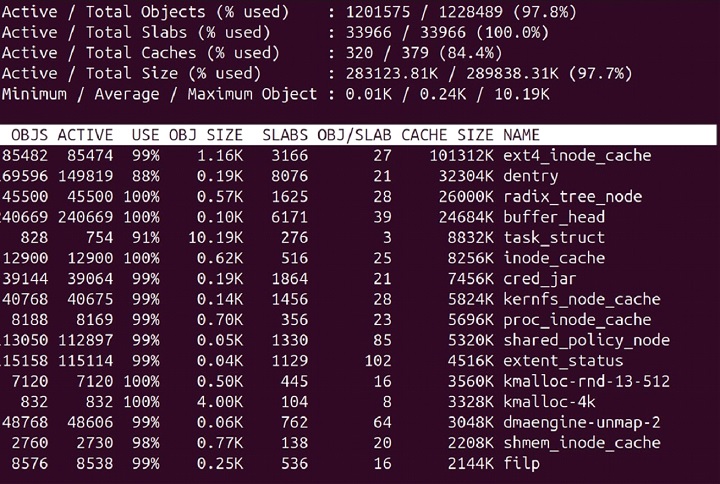
Sorting by Cache Size
To sort the output by cache size, use the -s c option −
sudo slabtop -s c
Changing the Refresh Interval
By default, slabtop refreshes the display every 3 seconds. You can change the refresh interval using the -d option followed by the number of seconds.
Changing the Refresh Interval to 5 Seconds
To change the refresh interval to 5 seconds, use the -d option −
sudo slabtop -d 5
Displaying a Limited Number of Entries
You can limit the number of entries displayed by slabtop using the -n option followed by the number of entries.
Displaying the Top 10 Entries
To display only the top 10 entries, use the -n option −
sudo slabtop -n 10
Running slabtop in Batch Mode
You can run slabtop in batch mode to generate a snapshot of the slab cache usage. This can be useful for logging or scripting purposes. Use the -o option to run slabtop in batch mode.
Running slabtop in Batch Mode
To run slabtop in batch mode, use the -o option −
sudo slabtop -o
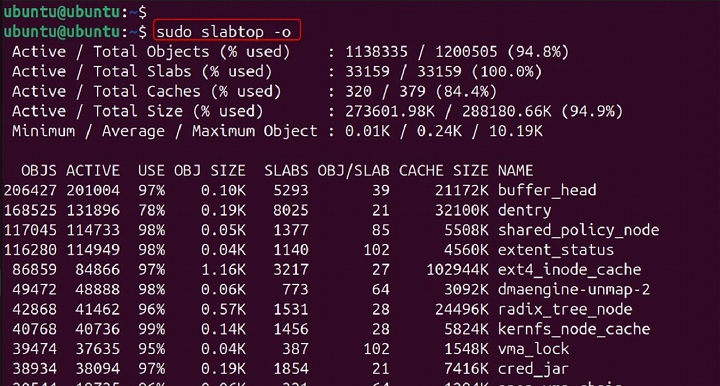
This will generate a single snapshot of the slab cache usage and exit.
Filtering Slab Caches by Name
You can filter the slab caches displayed by slabtop based on their name using the -F option followed by a string.
Filtering by Slab Cache Name
To display only slab caches that contain the string "inode" in their name, use the -F option −
sudo slabtop -F inode

Displaying Slabtop Version
You can display the version of slabtop using the -V option.
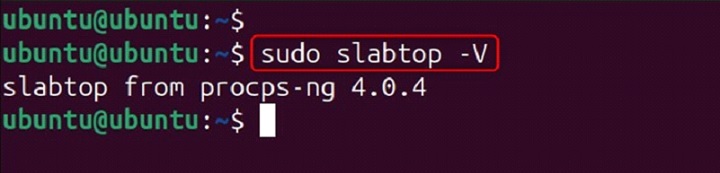
Displaying the Version of slabtop
To display the version of slabtop, use the -V option −
sudo slabtop -V
Combining Multiple Options
You can combine multiple options to customize the output of slabtop to meet your needs.
Combining Multiple Options
To sort the output by cache size, change the refresh interval to 5 seconds, and display only the top 10 entries, use the following command −
sudo slabtop -s c -d 5 -n 10

Monitoring Slabtop Output
You can monitor the output of slabtop for a specified period using the timeout command. This can be useful for capturing slab cache usage data over a specific duration.
Monitoring slabtop Output for 1 Minute
To monitor the output of slabtop for 1 minute, use the timeout command −
sudo timeout 1m slabtop
Redirecting Slabtop Output to a File
You can redirect the output of slabtop to a file for later analysis.
Redirecting slabtop Output to a File
To redirect the output of slabtop to a file called slabtop_output.txt, use the following command −
sudo slabtop > slabtop_output.txt

Conclusion
Analyzing the "obj/slab" ratio reveals the average number of objects per slab, indicating memory efficiency. High "active_objs" coupled with low "slabs" suggests efficient memory utilization, while the reverse might indicate fragmentation or inefficient caching. By correlating slabtop data with other system monitoring tools, administrators can gain a holistic view of kernel resource consumption and pinpoint performance bottlenecks stemming from slab cache management.
Interpreting slabtop's output requires understanding the relationship between slab caches and the kernel objects they manage. Each slab cache is tailored to a specific object type, such as inodes, dentrys, or TCP buffers.
