nhfsgraph Command in Linux
The nhfsgraph command in Linux is used to produce a PostScript graph of nhfsstone numbers. The nhfsgraph command generates a PostScript graph of nhfsstone numbers. The input <plotfile> must contain plot(5) number pairs derived from runs of nhfsstone at different loads.
By default, the output is in PostScript format. If you want a different output format, you can edit the script and replace psplot with plot.
Table of Contents
Here is a comprehensive guide to the options available with the nhfsgraph command −
Syntax of nhfsgraph Command
The following is the general syntax for the nhfsgraph Command
nhfsgraph <plotfile>
How to Produce a PostScript Graph of nhfsstone Numbers?
Since nhfsgraph isn't working directly, you can use gnuplot to achieve the same result. To produce a PostScript graph of nhfsstone numbers from an input plot file containing pairs of numbers, you can simply create a script using gnuplot to generate a PostScript graph −
This process usually involves using a script that reads the input file and generates the desired graph. The following is a step-by-step guide on how you can perform this task, along with a sample script −
Prepare the Input File (<plotfile>)
To get started, use your preferred text editor to create an input file (plotfile.txt) and add the following content to it −
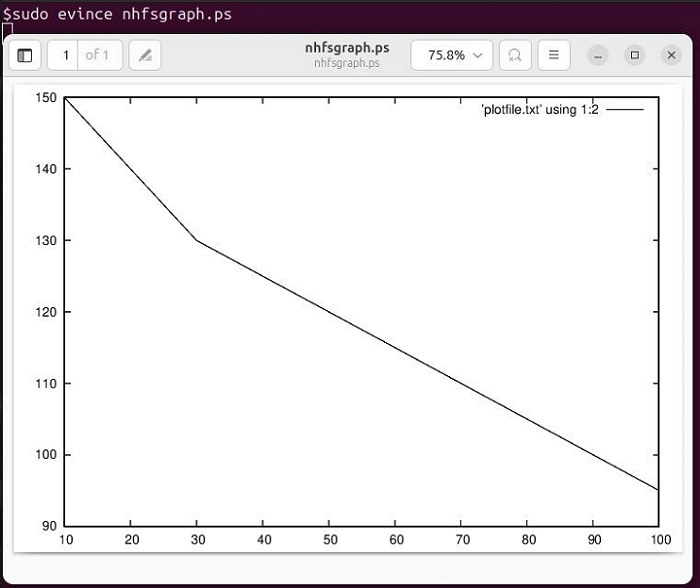
10 150
20 140
30 130
40 125
50 120
80 105
100 95
In this input file −
- The first column represents the load_value.
- The second column represents the corresponding nhfsstone_value.
You can create your input file with these pairs of numbers or similar data derived from your nhfsstone runs at different loads. Each pair should be on a new line.
Next, create a script (nhfsgraph.sh) that reads the input file and generates a PostScript graph using psplot. If you want a different output format, replace psplot with plot.
Generating a PostScript Graph Using Plot
The following is a basic example of a script that reads an input file and generates a PostScript graph using plot −
#!/bin/bash
# Check if the input file is provided
if [ -z "$1" ]; then
echo "Usage: $0 <plotfile>"
exit 1
fi
plotfile=$1
# Produce a PostScript graph using gnuplot
gnuplot -e "set terminal postscript; set output 'nhfsgraph.ps'; plot '$plotfile' using 1:2 with lines"
echo "PostScript graph generated: nhfsgraph.ps"
This script uses gnuplot to generate a PostScript graph with the following settings −
- set terminal postscript: Sets the terminal type to PostScript.
- set output 'nhfsgraph.ps': Sets the output file name to nhfsgraph.ps.
- plot '$plotfile' using 1:2 with lines title 'nhfsstone Graph': Plots the data from the input file using the first and second columns, with lines connecting the points and a title for the graph.
Save the script as nhfsgraph.sh and make it executable with the following command −
sudo chmod +x nhfsgraph.sh
Next, run the script with your input file −
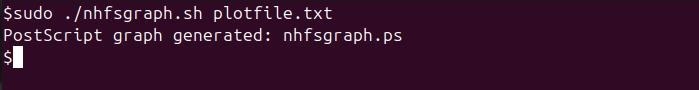
./nhfsgraph.sh plotfile.txt
This script reads the input file, extracts the pairs of numbers, and generates a PostScript graph named nhfsgraph.ps.
To view the graph, you can use the following command −
sudo evince nhfsgraph.ps
Conclusion
The nhfsgraph command in Unix and Linux is a powerful tool for generating PostScript graphs of nhfsstone performance data. By analyzing input files containing data pairs from nhfsstone runs, you can visualize performance trends at varying loads.
While nhfsgraph primarily outputs in PostScript format, customizations can be achieved by editing the script to utilize other formats. For environments where nhfsgraph is unavailable, tools like gnuplot provide a viable alternative for generating similar graphs.
This guide provides a step-by-step approach to creating input files, scripting the graph generation process, and viewing the resulting PostScript output, ensuring accessibility for performance analysis.
