jstack Command in Linux
A jstack command is an invaluable tool for Java application developers and system administrators working on Linux systems. It serves a critical role in diagnosing issues with Java applications, particularly those related to thread management and performance. The jstack command is a powerful utility for obtaining Java thread dumps in Linux environments. It's particularly useful for troubleshooting and analyzing Java applications.
Table of Contents
Here is a comprehensive guide to the options available with the jstack command −
Understanding the jstack Command
jstack is a utility that comes with the Java Development Kit (JDK) and is used to generate Java thread dumps. A thread dump is a snapshot of all the threads running in the Java Virtual Machine (JVM) at a given moment. It includes information about each thread's state and the stack trace of its execution. This information is crucial when troubleshooting issues such as deadlocks, and performance bottlenecks, or understanding the behavior of complex Java applications.
How to Use jstack Command in Linux?
The jstack command is a powerful utility for obtaining Java thread stack traces from a Java process or core file. It is a part of the Java JDK and is commonly used for diagnosing performance issues, analyzing thread dumps, and understanding the behavior of Java applications running on a Linux system.
Here is an explanation of the various options available with the jstack command −
| Options | Descriptions |
|---|---|
| No Option | When jstack is run without any options, it prints the Java stack traces for all threads in the target Java process. This is the most basic usage of jstack and provides a snapshot of what each thread in the process is doing at the moment of the snapshot. |
| -l (Long Listing) | This option provides additional information about locks when printing the Java stack traces. It is particularly useful for identifying deadlock situations as it includes details about object monitors and ownable synchronizers. |
| -m (Mixed Mode) | With this option, jstack prints both Java and native C++ stack frames. This is helpful when you need to see not only the Java stack traces but also the native stack frames to diagnose issues that involve interactions between Java and native libraries. |
| -F (Force) | This option is used when the Java process is unresponsive. It forces a stack dump, which can be useful for diagnosing deadlocked processes. |
| -help | By using this option, you can print out a help message that includes a brief description of the command and its options. |
| Remote Debugging | jstack can also be used for remote debugging by specifying the remote server's hostname and port. This allows you to obtain stack traces from a Java process that is running on a different machine. |
| Core File | jstack can be used to analyze a core dump file by specifying the path to the Java executable and the core file. This can provide insights into the state of the Java application at the time of the crash. |
A jstack command is a versatile tool that can be used in various scenarios to help diagnose and troubleshoot Java applications. It is important to use it with care, especially when working with production systems, as it can affect the performance of the application being diagnosed.
To use jstack, you need the process ID (PID) of the Java process you wish to inspect. You can obtain the PID using the jps command, which lists all Java processes currently running on the system −
jps -l

Basic Usage of jstack
To capture the basic stack traces of all threads in a Java process, you can use the simple command −
jstack <java_pid>
Replace <java_pid> with the process ID of your Java application.
Let's generate a thread dump of a Java process, you can use the jstack command followed by the process ID (PID) of the Java process −
jstack 5384
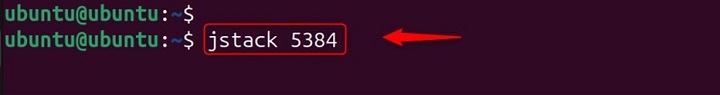
This command prints the Java stack traces for all threads in the specified Java process. It's helpful when you want to examine the current stack traces to troubleshoot performance issues or detect deadlocks.
Mixed Mode Stack Traces
If you need to see both Java and native C++ stack frames, jstack provides the -m option −
jstack -m <java_pid>
This mixed-mode stack trace is particularly helpful when you're dealing with performance issues or bugs that involve both Java and native code.
If you need to inspect both Java and native C++ stack frames, you can use the -m option −
jstack -m 5384
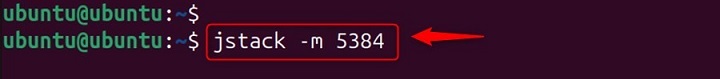
This command prints mixed mode (Java/C++) stack traces for all threads, which can be crucial for detecting issues that involve interactions between Java and native code.
Generating Thread Dumps Continuously
For threads that are waiting on object monitors or ownable synchronizers, the -l option can be added to display additional lock information −
jstack -l <java_pid>
This aids in identifying deadlock situations or contention points within your application.
Sometimes, capturing a single thread dump isn't enough. You might need to generate them continuously to observe the evolution of thread states over time. Here's how you can do it −
jstack -l 5384 > jstack.out
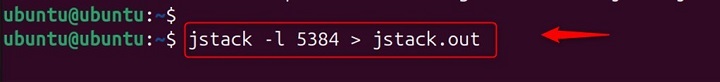
You can run this command multiple times, spacing out the executions as needed.
Analyzing Java Core Dumps
In the event of a JVM crash, jstack can be used to analyze core dump files with the following syntax −
jstack <executable> <core_dump>
Here, <executable> is the path to the Java executable, and <core_dump> is the path to the core dump file generated by the JVM crash.
In the event of a Java application crash, you might have a core dump file. To analyze this file, use the jstack command with the path to the Java executable and the core dump file −
jstack /usr/bin/java file.core
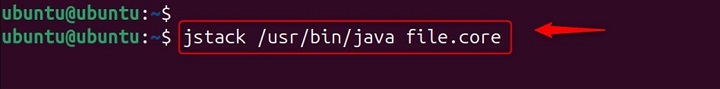
This will print the stack traces from the Java core dump, allowing you to analyze the state of the application at the time of the crash.
Scripting with jstack
For more advanced usage, you can incorporate jstack into scripts to automate the collection of thread dumps. For example, you can create a script that captures a series of thread dumps spaced 20 seconds apart −
sh ./threaddump_linux.sh 5384
Before using such a script in a production environment, make sure to test it thoroughly to ensure it functions correctly in your specific setup.
Conclusion
The jstack command is a powerful diagnostic tool that should be part of every Java developer's toolkit. Its ability to provide insight into the JVM's thread activity makes it essential for maintaining healthy and performant Java applications on Linux systems.
