- Graph Theory - Home
- Graph Theory - Introduction
- Graph Theory - History
- Graph Theory - Fundamentals
- Graph Theory - Applications
- Types of Graphs
- Graph Theory - Types of Graphs
- Graph Theory - Simple Graphs
- Graph Theory - Multi-graphs
- Graph Theory - Directed Graphs
- Graph Theory - Weighted Graphs
- Graph Theory - Bipartite Graphs
- Graph Theory - Complete Graphs
- Graph Theory - Subgraphs
- Graph Theory - Trees
- Graph Theory - Forests
- Graph Theory - Planar Graphs
- Graph Theory - Hypergraphs
- Graph Theory - Infinite Graphs
- Graph Theory - Random Graphs
- Graph Representation
- Graph Theory - Graph Representation
- Graph Theory - Adjacency Matrix
- Graph Theory - Adjacency List
- Graph Theory - Incidence Matrix
- Graph Theory - Edge List
- Graph Theory - Compact Representation
- Graph Theory - Incidence Structure
- Graph Theory - Matrix-Tree Theorem
- Graph Properties
- Graph Theory - Basic Properties
- Graph Theory - Coverings
- Graph Theory - Matchings
- Graph Theory - Independent Sets
- Graph Theory - Traversability
- Graph Theory Connectivity
- Graph Theory - Connectivity
- Graph Theory - Vertex Connectivity
- Graph Theory - Edge Connectivity
- Graph Theory - k-Connected Graphs
- Graph Theory - 2-Vertex-Connected Graphs
- Graph Theory - 2-Edge-Connected Graphs
- Graph Theory - Strongly Connected Graphs
- Graph Theory - Weakly Connected Graphs
- Graph Theory - Connectivity in Planar Graphs
- Graph Theory - Connectivity in Dynamic Graphs
- Special Graphs
- Graph Theory - Regular Graphs
- Graph Theory - Complete Bipartite Graphs
- Graph Theory - Chordal Graphs
- Graph Theory - Line Graphs
- Graph Theory - Complement Graphs
- Graph Theory - Graph Products
- Graph Theory - Petersen Graph
- Graph Theory - Cayley Graphs
- Graph Theory - De Bruijn Graphs
- Graph Algorithms
- Graph Theory - Graph Algorithms
- Graph Theory - Breadth-First Search
- Graph Theory - Depth-First Search (DFS)
- Graph Theory - Dijkstra's Algorithm
- Graph Theory - Bellman-Ford Algorithm
- Graph Theory - Floyd-Warshall Algorithm
- Graph Theory - Johnson's Algorithm
- Graph Theory - A* Search Algorithm
- Graph Theory - Kruskal's Algorithm
- Graph Theory - Prim's Algorithm
- Graph Theory - Borůvka's Algorithm
- Graph Theory - Ford-Fulkerson Algorithm
- Graph Theory - Edmonds-Karp Algorithm
- Graph Theory - Push-Relabel Algorithm
- Graph Theory - Dinic's Algorithm
- Graph Theory - Hopcroft-Karp Algorithm
- Graph Theory - Tarjan's Algorithm
- Graph Theory - Kosaraju's Algorithm
- Graph Theory - Karger's Algorithm
- Graph Coloring
- Graph Theory - Coloring
- Graph Theory - Edge Coloring
- Graph Theory - Total Coloring
- Graph Theory - Greedy Coloring
- Graph Theory - Four Color Theorem
- Graph Theory - Coloring Bipartite Graphs
- Graph Theory - List Coloring
- Advanced Topics of Graph Theory
- Graph Theory - Chromatic Number
- Graph Theory - Chromatic Polynomial
- Graph Theory - Graph Labeling
- Graph Theory - Planarity & Kuratowski's Theorem
- Graph Theory - Planarity Testing Algorithms
- Graph Theory - Graph Embedding
- Graph Theory - Graph Minors
- Graph Theory - Isomorphism
- Spectral Graph Theory
- Graph Theory - Graph Laplacians
- Graph Theory - Cheeger's Inequality
- Graph Theory - Graph Clustering
- Graph Theory - Graph Partitioning
- Graph Theory - Tree Decomposition
- Graph Theory - Treewidth
- Graph Theory - Branchwidth
- Graph Theory - Graph Drawings
- Graph Theory - Force-Directed Methods
- Graph Theory - Layered Graph Drawing
- Graph Theory - Orthogonal Graph Drawing
- Graph Theory - Examples
- Computational Complexity of Graph
- Graph Theory - Time Complexity
- Graph Theory - Space Complexity
- Graph Theory - NP-Complete Problems
- Graph Theory - Approximation Algorithms
- Graph Theory - Parallel & Distributed Algorithms
- Graph Theory - Algorithm Optimization
- Graphs in Computer Science
- Graph Theory - Data Structures for Graphs
- Graph Theory - Graph Implementations
- Graph Theory - Graph Databases
- Graph Theory - Query Languages
- Graph Algorithms in Machine Learning
- Graph Neural Networks
- Graph Theory - Link Prediction
- Graph-Based Clustering
- Graph Theory - PageRank Algorithm
- Graph Theory - HITS Algorithm
- Graph Theory - Social Network Analysis
- Graph Theory - Centrality Measures
- Graph Theory - Community Detection
- Graph Theory - Influence Maximization
- Graph Theory - Graph Compression
- Graph Theory Real-World Applications
- Graph Theory - Network Routing
- Graph Theory - Traffic Flow
- Graph Theory - Web Crawling Data Structures
- Graph Theory - Computer Vision
- Graph Theory - Recommendation Systems
- Graph Theory - Biological Networks
- Graph Theory - Social Networks
- Graph Theory - Smart Grids
- Graph Theory - Telecommunications
- Graph Theory - Knowledge Graphs
- Graph Theory - Game Theory
- Graph Theory - Urban Planning
- Graph Theory Useful Resources
- Graph Theory - Quick Guide
- Graph Theory - Useful Resources
- Graph Theory - Discussion
Graph Theory - Line Graphs
Line graph
A line graph is a type of graph that represents the adjacency relationships between edges of another graph. In a line graph, the vertices represent the edges of the original graph, and two vertices are connected if the corresponding edges in the original graph share a common vertex.
Consider a simple graph G with vertices V = {A, B, C} and edges E = { (A, B), (B, C), (A, C)}. The line graph L(G) will have vertices corresponding to the edges in "G" (i.e., one vertex for each edge in E). These vertices are connected if the edges in G share a common vertex −

Properties of Line Graph
The line graph has various properties that differentiate it from other types of graphs, they are −
- Vertex Correspondence: Each vertex in the line graph corresponds to an edge in the original graph.
- Edge Connection: Two vertices in the line graph are connected if and only if the corresponding edges in the original graph share a common vertex.
- Degree of Vertices: The degree of a vertex in the line graph equals the number of edges incident to the corresponding vertex in the original graph.
Constructing a Line Graph
To construct a line graph from a given graph, follow these steps −
Identify all edges in the original graph G:
Let G = (V, E) be a graph with vertex set V and edge set E. The edges of G are denoted as E = {e1, e2, ..., em}.
Create a new vertex for each edge in the original graph G:
Define a new graph L(G) where each edge ei of G corresponds to a vertex vi in L(G). Thus, the vertex set of L(G) is V' = {v1, v2, ..., vm}.
Connect two vertices in the line graph if their corresponding edges in the original graph share a common vertex:
In L(G), there is an edge between vi and vj if and only if the corresponding edges ei and ej in G share a common vertex. Mathematically, this can be represented as:
E' = {(vi, vj) | ei = (u, v) and ej = (u, w) for some u, v, w ∈ V or ei = (v, u) and ej = (w, u) for some u, v, w ∈ V}
Thus, the edge set E' of L(G) consists of pairs of vertices (vi, vj) where the edges ei and ej in G are incident to a common vertex in G.
Example
Consider the following graph G −
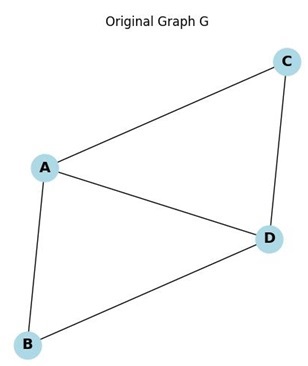
- Step 1: Identify all edges in G: E = {AB, AC, AD, BD, CD}
- Step 2: Create a new vertex for each edge in G: Vertices in L(G) are {vAB, vAC, vAD, vBD, vCD}
- Step 3: Connect two vertices in L(G) if their corresponding edges in G share a common vertex:
- vAB is connected to vAD and vBD because edges AB, AD, and BD share vertices A and B in G.
- vAC is connected to vAD and vCD because edges AC, AD, and CD share vertices A and C in G.
- vAD is connected to vAB, vAC, vBD, and vCD because edges AD share vertices A and D in G.
- vBD is connected to vAB, vAD, and vCD because edges BD share vertices B and D in G.
- vCD is connected to vAC, vAD, and vBD because edges CD share vertices C and D in G.
Thus, the line graph L(G) would look like −
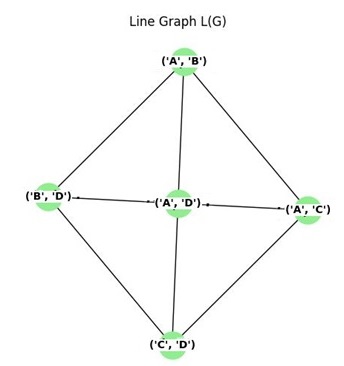
Here, vertices in the line graph L(G) are connected based on the shared vertices of the original graph G's edges.
Types of Line Graphs
Line graphs can be classified into several types, depending on the characteristics and relationships of the edges in the original graph. Some common types are as follows −
- Simple Line Graph
- Multiple Line Graph
- Compound Line Graph
- Connected Line Graph
- Planar Line Graph
Simple Line Graph
A simple line graph is constructed from a simple graph where each edge is distinct. The vertices in the line graph represent edges in the original graph, and edges between these vertices are created if the corresponding edges in the original graph are incident to the same vertex.
The above image shows the line graph of a simple graph where each vertex corresponds to an edge in the original graph.
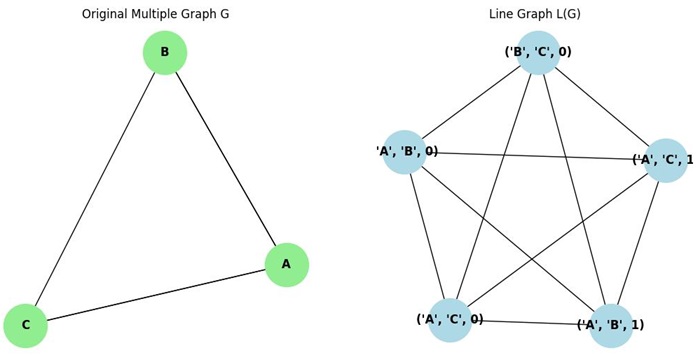
Multiple Line Graph
A multiple line graph is created from a graph with multiple edges between some pairs of vertices. The line graph will contain vertices representing these multiple edges and edges connecting them based on the adjacency of edges in the original graph.
The multiple graph G is created with vertices {A,B,C} and multiple edges, including two edges between A and B and two edges between A and C −
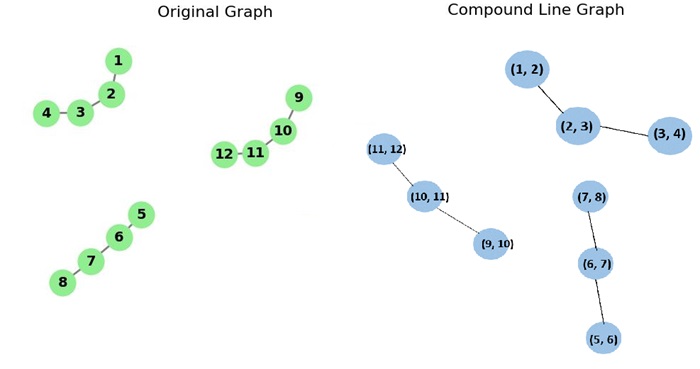
Compound Line Graph
A compound line graph arises from a graph that is made up of multiple subgraphs. The edges in the compound graph correspond to different components in the original graph, and the line graph represents the relationships between these components.
The below image depicts the compound line graph formed by a graph with multiple components −
Parts of a Line Graph
A line graph consists of various parts that help us understand its structure and meaning. These include the title, legend, data, and axes. Let us discuss each part in detail −
- Title
- Legend
- Data
- X-axis
- Y-axis
Title
The title of a line graph provides a brief description of what the graph represents. It is an important part of any graph as it informs you about the context of the data being presented.

In this example, the title "Line Graph" gives a clear indication of what the graph is displaying, helping you to understand its significance.
Legend
The legend helps identify the different lines or data series in the graph. It uses colors or symbols to represent each series, making the graph easier to interpret.
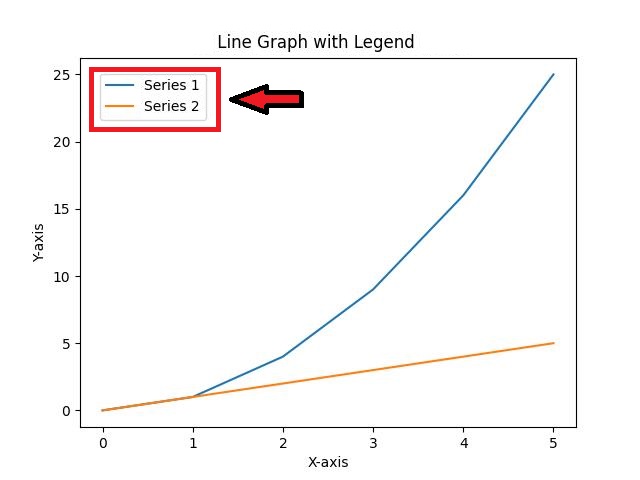
The legend shown here corresponds to the different data series in the line graph, providing clarity about each line's meaning.
Data
Data points are the foundation of any line graph. They represent the values that are plotted on the graph based on the x-axis and y-axis coordinates. These points are connected by lines to show the relationship between the variables.
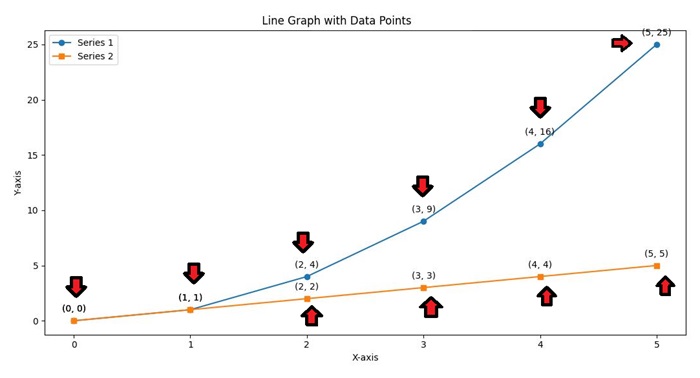
This image highlights the data points plotted on the graph, which are connected by lines to show trends and relationships.
X-axis
The X-axis represents the independent variable in a line graph. It is typically placed horizontally at the bottom of the graph and is used to plot the categories or time intervals associated with the data.
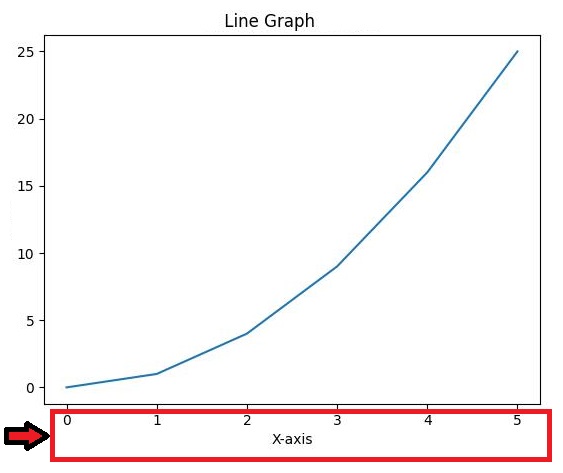
Here, the X-axis represents the different time intervals, which are plotted against the corresponding data points.
Y-axis
The Y-axis represents the dependent variable in a line graph. It is typically placed vertically on the left side of the graph and is used to plot the values or measurements of the data.

The Y-axis in this example shows the values that correspond to the data points along the X-axis.
Line Graph of a Simple Graph
Consider a simple graph with 3 vertices and 3 edges. The line graph of this graph will have 3 vertices, each corresponding to one edge of the original graph.
If two edges from the original graph share a common vertex, their corresponding vertices in the line graph will be connected by an edge.
Line Graph of a Tree
The line graph of a tree is formed by connecting vertices in the line graph based on the adjacency of the edges in the original tree. Since a tree has no cycles, the resulting line graph will also have no cycles, making it a forest (a collection of trees).
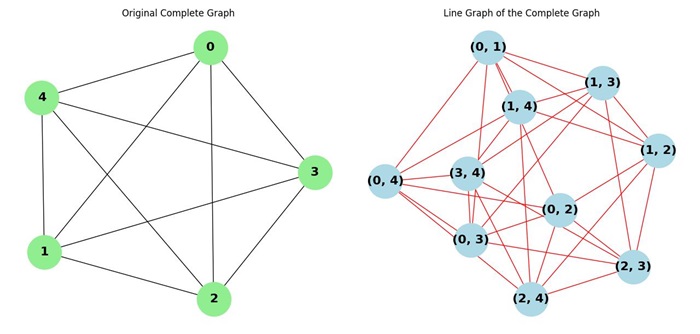
Line Graph of a Complete Graph
A complete graph is a graph where every pair of distinct vertices is connected by an edge. The line graph of a complete graph changes depending on the number of vertices in the original graph. As the number of vertices increases, the line graph becomes more complex.