- Graph Theory - Home
- Graph Theory - Introduction
- Graph Theory - History
- Graph Theory - Fundamentals
- Graph Theory - Applications
- Types of Graphs
- Graph Theory - Types of Graphs
- Graph Theory - Simple Graphs
- Graph Theory - Multi-graphs
- Graph Theory - Directed Graphs
- Graph Theory - Weighted Graphs
- Graph Theory - Bipartite Graphs
- Graph Theory - Complete Graphs
- Graph Theory - Subgraphs
- Graph Theory - Trees
- Graph Theory - Forests
- Graph Theory - Planar Graphs
- Graph Theory - Hypergraphs
- Graph Theory - Infinite Graphs
- Graph Theory - Random Graphs
- Graph Representation
- Graph Theory - Graph Representation
- Graph Theory - Adjacency Matrix
- Graph Theory - Adjacency List
- Graph Theory - Incidence Matrix
- Graph Theory - Edge List
- Graph Theory - Compact Representation
- Graph Theory - Incidence Structure
- Graph Theory - Matrix-Tree Theorem
- Graph Properties
- Graph Theory - Basic Properties
- Graph Theory - Coverings
- Graph Theory - Matchings
- Graph Theory - Independent Sets
- Graph Theory - Traversability
- Graph Theory Connectivity
- Graph Theory - Connectivity
- Graph Theory - Vertex Connectivity
- Graph Theory - Edge Connectivity
- Graph Theory - k-Connected Graphs
- Graph Theory - 2-Vertex-Connected Graphs
- Graph Theory - 2-Edge-Connected Graphs
- Graph Theory - Strongly Connected Graphs
- Graph Theory - Weakly Connected Graphs
- Graph Theory - Connectivity in Planar Graphs
- Graph Theory - Connectivity in Dynamic Graphs
- Special Graphs
- Graph Theory - Regular Graphs
- Graph Theory - Complete Bipartite Graphs
- Graph Theory - Chordal Graphs
- Graph Theory - Line Graphs
- Graph Theory - Complement Graphs
- Graph Theory - Graph Products
- Graph Theory - Petersen Graph
- Graph Theory - Cayley Graphs
- Graph Theory - De Bruijn Graphs
- Graph Algorithms
- Graph Theory - Graph Algorithms
- Graph Theory - Breadth-First Search
- Graph Theory - Depth-First Search (DFS)
- Graph Theory - Dijkstra's Algorithm
- Graph Theory - Bellman-Ford Algorithm
- Graph Theory - Floyd-Warshall Algorithm
- Graph Theory - Johnson's Algorithm
- Graph Theory - A* Search Algorithm
- Graph Theory - Kruskal's Algorithm
- Graph Theory - Prim's Algorithm
- Graph Theory - Borůvka's Algorithm
- Graph Theory - Ford-Fulkerson Algorithm
- Graph Theory - Edmonds-Karp Algorithm
- Graph Theory - Push-Relabel Algorithm
- Graph Theory - Dinic's Algorithm
- Graph Theory - Hopcroft-Karp Algorithm
- Graph Theory - Tarjan's Algorithm
- Graph Theory - Kosaraju's Algorithm
- Graph Theory - Karger's Algorithm
- Graph Coloring
- Graph Theory - Coloring
- Graph Theory - Edge Coloring
- Graph Theory - Total Coloring
- Graph Theory - Greedy Coloring
- Graph Theory - Four Color Theorem
- Graph Theory - Coloring Bipartite Graphs
- Graph Theory - List Coloring
- Advanced Topics of Graph Theory
- Graph Theory - Chromatic Number
- Graph Theory - Chromatic Polynomial
- Graph Theory - Graph Labeling
- Graph Theory - Planarity & Kuratowski's Theorem
- Graph Theory - Planarity Testing Algorithms
- Graph Theory - Graph Embedding
- Graph Theory - Graph Minors
- Graph Theory - Isomorphism
- Spectral Graph Theory
- Graph Theory - Graph Laplacians
- Graph Theory - Cheeger's Inequality
- Graph Theory - Graph Clustering
- Graph Theory - Graph Partitioning
- Graph Theory - Tree Decomposition
- Graph Theory - Treewidth
- Graph Theory - Branchwidth
- Graph Theory - Graph Drawings
- Graph Theory - Force-Directed Methods
- Graph Theory - Layered Graph Drawing
- Graph Theory - Orthogonal Graph Drawing
- Graph Theory - Examples
- Computational Complexity of Graph
- Graph Theory - Time Complexity
- Graph Theory - Space Complexity
- Graph Theory - NP-Complete Problems
- Graph Theory - Approximation Algorithms
- Graph Theory - Parallel & Distributed Algorithms
- Graph Theory - Algorithm Optimization
- Graphs in Computer Science
- Graph Theory - Data Structures for Graphs
- Graph Theory - Graph Implementations
- Graph Theory - Graph Databases
- Graph Theory - Query Languages
- Graph Algorithms in Machine Learning
- Graph Neural Networks
- Graph Theory - Link Prediction
- Graph-Based Clustering
- Graph Theory - PageRank Algorithm
- Graph Theory - HITS Algorithm
- Graph Theory - Social Network Analysis
- Graph Theory - Centrality Measures
- Graph Theory - Community Detection
- Graph Theory - Influence Maximization
- Graph Theory - Graph Compression
- Graph Theory Real-World Applications
- Graph Theory - Network Routing
- Graph Theory - Traffic Flow
- Graph Theory - Web Crawling Data Structures
- Graph Theory - Computer Vision
- Graph Theory - Recommendation Systems
- Graph Theory - Biological Networks
- Graph Theory - Social Networks
- Graph Theory - Smart Grids
- Graph Theory - Telecommunications
- Graph Theory - Knowledge Graphs
- Graph Theory - Game Theory
- Graph Theory - Urban Planning
- Graph Theory Useful Resources
- Graph Theory - Quick Guide
- Graph Theory - Useful Resources
- Graph Theory - Discussion
Graph Theory - Force-Directed Methods
Force-Directed Methods
Force-Directed Methods are techniques used to draw graphs in a way that makes them easy to understand. These methods try to place the nodes (or vertices) so that there are fewer edge crossings and the nodes are spread out evenly.
The idea comes from physics, where forces like attraction and repulsion act on objects. In this case, nodes push away from each other, and edges pull connected nodes together, helping create a clear and balanced graph layout.
- Physical Forces: Nodes in the graph repel each other, and edges act like springs that attract connected nodes.
- Equilibrium: The goal is to reach a state of equilibrium where the forces balance out, resulting in a pleasing layout.
- Efficiency: These methods are particularly effective for un-directed graphs.
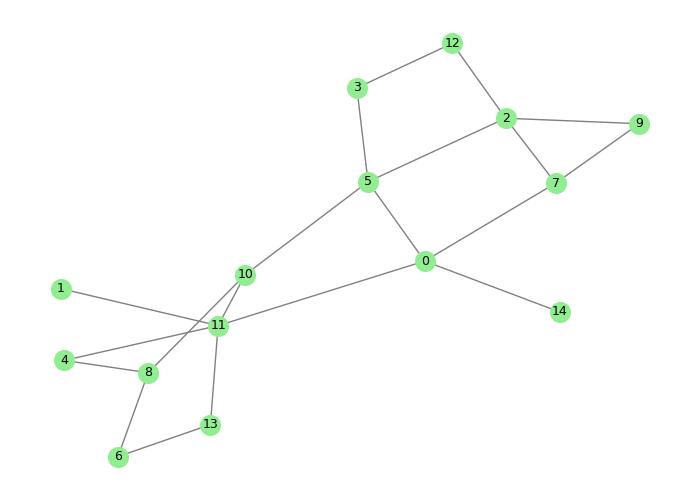
The above image illustrates a force-directed layout with vertices pushed away from each other while edges pull connected vertices closer.
Principle of Force-Directed Methods
The basic idea behind force-directed methods is to treat the graph as a system of physical bodies. Each node in the graph is treated like a charged particle that repels other nodes, while edges act as springs that attract the nodes they connect. This process is iterated until the system reaches a stable configuration.
- Repulsive Force: Nodes experience a repulsive force that pushes them away from each other, reducing node overlaps.
- Attractive Force: Edges act like springs, pulling connected nodes together to maintain their relationship.
- Equilibrium: The layout reaches equilibrium when the forces are balanced, minimizing edge crossings and optimizing the graph layout.
Force-Directed Layout Algorithms
There are different algorithms that use force-directed methods, each applying forces in its own way to arrange the nodes. Here are some common ones −
- Fruchterman-Reingold Algorithm It uses a combination of attractive and repulsive forces to create a balanced layout.
- Spring Layout: In this algorithm, edges are treated like springs. The goal is to reduce the system's energy to make the graph look nice and balanced.
- Force Atlas: Designed for large graphs, this algorithm speeds up the layout process and reduces edge crossings by modifying the spring layout.
- Kamada-Kawai Algorithm: This algorithm minimizes the energy of the graph using attractive forces between nodes based on the graph's distance matrix.
Fruchterman-Reingold Algorithm
The Fruchterman-Reingold algorithm is one of the most popular force-directed algorithms. It works by applying repulsive forces between nodes and attractive forces along the edges. The algorithm keeps adjusting the positions of the nodes until the graph settles into a balanced and stable layout.

The image above demonstrates the result of applying the Fruchterman-Reingold algorithm to a graph.
Force-Directed Layout with Python
Let us create a graph and apply a force-directed layout using Python's networkx and matplotlib libraries.
In the following example, we are applying the spring_layout() function from the networkx library, which implements a force-directed layout to arrange the nodes and edges of the graph −
import networkx as nx
import matplotlib.pyplot as plt

# Create a graph
G = nx.Graph()
G.add_edges_from([(1, 2), (2, 3), (3, 4), (4, 1), (2, 4)])

# Apply the spring layout for force-directed graph drawing
pos = nx.spring_layout(G)

# Draw the graph
nx.draw(G, pos, with_labels=True, node_color="lightgreen", edge_color="blue")

# Display the graph
plt.title("Force-Directed Graph Layout (Fruchterman-Reingold)")
plt.show()
The above code generates a graph using the Fruchterman-Reingold algorithm to determine the positions of nodes, creating an optimal layout for the graph −

Energy Functions and Optimization
In force-directed methods, the layout of the graph is created by reducing the "energy" in the system. This energy is influenced by both attractive forces (pulling nodes together) and repulsive forces (pushing nodes apart).
The goal is to find the arrangement that minimizes the total energy, making the graph balanced and clear. The energy function is a mathematical way to measure how well the forces are working together to create an optimal layout. It often takes the following form −
E = Erepulsive + Eattractive
- Repulsive Energy (Erepulsive): The repulsive energy between two nodes is inversely proportional to the distance between them. The closer two nodes are, the stronger is the repulsive force.
- Attractive Energy (Eattractive): The attractive energy between two nodes connected by an edge is proportional to the distance between them. The nodes are pulled closer to maintain the edge connection.
The algorithm moves the nodes step by step to reduce the energy in the system. It keeps adjusting the positions until the forces (attraction and repulsion) balance out, and the graph reaches a stable, clear layout.
Challenges in Force-Directed Methods
Although force-directed methods work well for many types of graphs, they face some challenges −
- Performance: These algorithms can be slow when dealing with large graphs, especially if there are a lot of nodes and edges.
- Local Minima: Sometimes the algorithm may get stuck in a position that isn't the best possible layout, resulting in a suboptimal graph.
- Edge Crossings: Although the force-directed methods aim to reduce edge crossings, they may still occur, especially in dense graphs.
- Scalability: As the graph size grows, the algorithm takes more time and resources to process, which can make it difficult to use for very large graphs.
Optimizations for Force-Directed Methods
To make force-directed methods work better and faster, several improvements have been proposed −
- Multilevel Layout: This method first simplifies the graph into a smaller version, applies the force-directed technique, and then gradually refines the layout at each level, improving the final result.
- Adaptive Forces: Some methods adjust the forces depending on the structure of the graph, helping to make the layout process faster and more accurate.
- Graph Simplification: For large graphs, simplifying the graph (e.g., by removing less important edges) can reduce complexity, speeding up the layout process.
