- Graph Theory - Home
- Graph Theory - Introduction
- Graph Theory - History
- Graph Theory - Fundamentals
- Graph Theory - Applications
- Types of Graphs
- Graph Theory - Types of Graphs
- Graph Theory - Simple Graphs
- Graph Theory - Multi-graphs
- Graph Theory - Directed Graphs
- Graph Theory - Weighted Graphs
- Graph Theory - Bipartite Graphs
- Graph Theory - Complete Graphs
- Graph Theory - Subgraphs
- Graph Theory - Trees
- Graph Theory - Forests
- Graph Theory - Planar Graphs
- Graph Theory - Hypergraphs
- Graph Theory - Infinite Graphs
- Graph Theory - Random Graphs
- Graph Representation
- Graph Theory - Graph Representation
- Graph Theory - Adjacency Matrix
- Graph Theory - Adjacency List
- Graph Theory - Incidence Matrix
- Graph Theory - Edge List
- Graph Theory - Compact Representation
- Graph Theory - Incidence Structure
- Graph Theory - Matrix-Tree Theorem
- Graph Properties
- Graph Theory - Basic Properties
- Graph Theory - Coverings
- Graph Theory - Matchings
- Graph Theory - Independent Sets
- Graph Theory - Traversability
- Graph Theory Connectivity
- Graph Theory - Connectivity
- Graph Theory - Vertex Connectivity
- Graph Theory - Edge Connectivity
- Graph Theory - k-Connected Graphs
- Graph Theory - 2-Vertex-Connected Graphs
- Graph Theory - 2-Edge-Connected Graphs
- Graph Theory - Strongly Connected Graphs
- Graph Theory - Weakly Connected Graphs
- Graph Theory - Connectivity in Planar Graphs
- Graph Theory - Connectivity in Dynamic Graphs
- Special Graphs
- Graph Theory - Regular Graphs
- Graph Theory - Complete Bipartite Graphs
- Graph Theory - Chordal Graphs
- Graph Theory - Line Graphs
- Graph Theory - Complement Graphs
- Graph Theory - Graph Products
- Graph Theory - Petersen Graph
- Graph Theory - Cayley Graphs
- Graph Theory - De Bruijn Graphs
- Graph Algorithms
- Graph Theory - Graph Algorithms
- Graph Theory - Breadth-First Search
- Graph Theory - Depth-First Search (DFS)
- Graph Theory - Dijkstra's Algorithm
- Graph Theory - Bellman-Ford Algorithm
- Graph Theory - Floyd-Warshall Algorithm
- Graph Theory - Johnson's Algorithm
- Graph Theory - A* Search Algorithm
- Graph Theory - Kruskal's Algorithm
- Graph Theory - Prim's Algorithm
- Graph Theory - Borůvka's Algorithm
- Graph Theory - Ford-Fulkerson Algorithm
- Graph Theory - Edmonds-Karp Algorithm
- Graph Theory - Push-Relabel Algorithm
- Graph Theory - Dinic's Algorithm
- Graph Theory - Hopcroft-Karp Algorithm
- Graph Theory - Tarjan's Algorithm
- Graph Theory - Kosaraju's Algorithm
- Graph Theory - Karger's Algorithm
- Graph Coloring
- Graph Theory - Coloring
- Graph Theory - Edge Coloring
- Graph Theory - Total Coloring
- Graph Theory - Greedy Coloring
- Graph Theory - Four Color Theorem
- Graph Theory - Coloring Bipartite Graphs
- Graph Theory - List Coloring
- Advanced Topics of Graph Theory
- Graph Theory - Chromatic Number
- Graph Theory - Chromatic Polynomial
- Graph Theory - Graph Labeling
- Graph Theory - Planarity & Kuratowski's Theorem
- Graph Theory - Planarity Testing Algorithms
- Graph Theory - Graph Embedding
- Graph Theory - Graph Minors
- Graph Theory - Isomorphism
- Spectral Graph Theory
- Graph Theory - Graph Laplacians
- Graph Theory - Cheeger's Inequality
- Graph Theory - Graph Clustering
- Graph Theory - Graph Partitioning
- Graph Theory - Tree Decomposition
- Graph Theory - Treewidth
- Graph Theory - Branchwidth
- Graph Theory - Graph Drawings
- Graph Theory - Force-Directed Methods
- Graph Theory - Layered Graph Drawing
- Graph Theory - Orthogonal Graph Drawing
- Graph Theory - Examples
- Computational Complexity of Graph
- Graph Theory - Time Complexity
- Graph Theory - Space Complexity
- Graph Theory - NP-Complete Problems
- Graph Theory - Approximation Algorithms
- Graph Theory - Parallel & Distributed Algorithms
- Graph Theory - Algorithm Optimization
- Graphs in Computer Science
- Graph Theory - Data Structures for Graphs
- Graph Theory - Graph Implementations
- Graph Theory - Graph Databases
- Graph Theory - Query Languages
- Graph Algorithms in Machine Learning
- Graph Neural Networks
- Graph Theory - Link Prediction
- Graph-Based Clustering
- Graph Theory - PageRank Algorithm
- Graph Theory - HITS Algorithm
- Graph Theory - Social Network Analysis
- Graph Theory - Centrality Measures
- Graph Theory - Community Detection
- Graph Theory - Influence Maximization
- Graph Theory - Graph Compression
- Graph Theory Real-World Applications
- Graph Theory - Network Routing
- Graph Theory - Traffic Flow
- Graph Theory - Web Crawling Data Structures
- Graph Theory - Computer Vision
- Graph Theory - Recommendation Systems
- Graph Theory - Biological Networks
- Graph Theory - Social Networks
- Graph Theory - Smart Grids
- Graph Theory - Telecommunications
- Graph Theory - Knowledge Graphs
- Graph Theory - Game Theory
- Graph Theory - Urban Planning
- Graph Theory Useful Resources
- Graph Theory - Quick Guide
- Graph Theory - Useful Resources
- Graph Theory - Discussion
Graph Theory - Graph Drawing
Graph Drawing
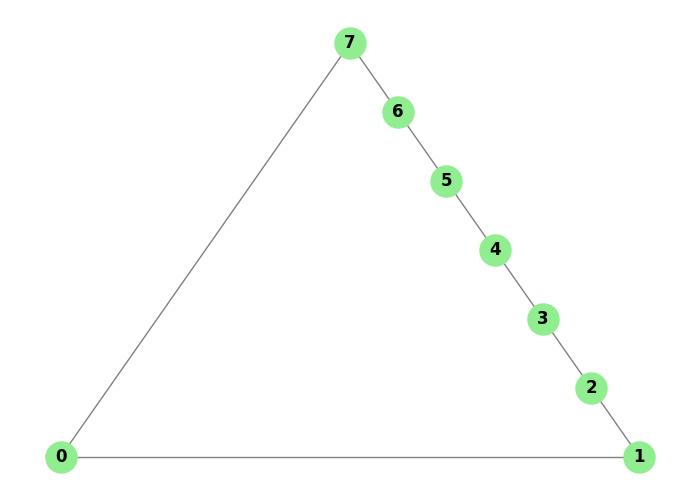
Graph Drawing is the process of creating a visual representation of a graph. It helps in understanding the structure and properties of graphs by providing a geometric layout of vertices and edges.
- Graph drawing turns abstract ideas into visual pictures.
- It is commonly used in network analysis, data visualization, and algorithm development.
- The main aim is to make layouts clear, simple, and meaningful.
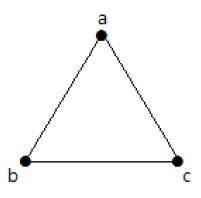
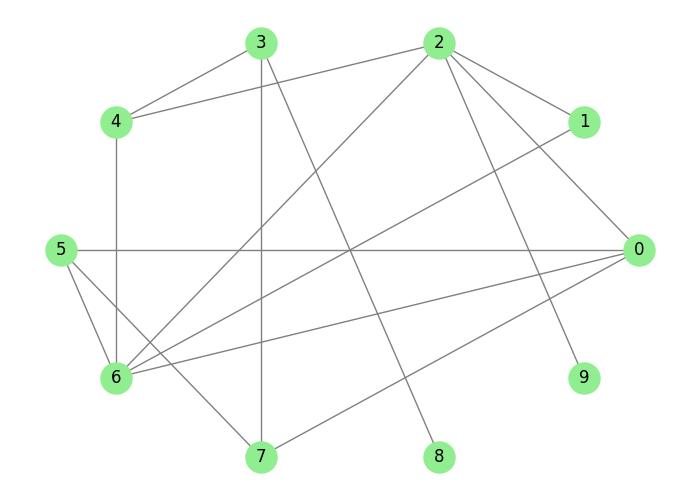
The above image displays a simple graph.
Importance of Graph Drawing
Graph drawing is helpulf for understanding complex relationships. Its important uses are −
- Visualization: Converts abstract graph data into easy-to-understand visual pictures.
- Analysis: Helps to detect patterns, groups (clusters), and unusual data (anomalies).
- Communication: Makes it easier to explain graph structures clearly.
- Problem-Solving: Assists in designing and debugging algorithm through graphical insights.
Major Concepts in Graph Drawing
Graph drawing consists of various major concepts that influence how the graph is represented −
- Planarity: A graph is planar if it can be drawn on a plane without any edges crossing each other.
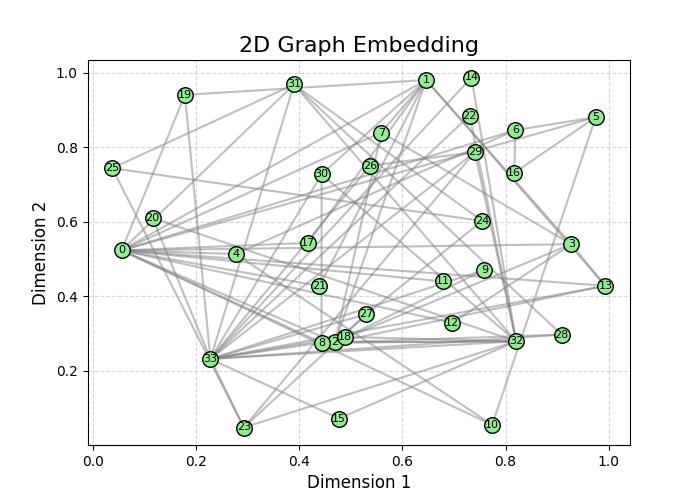
- Embedding: Placing the nodes and edges of a graph in 2D or 3D space.
- Edge Routing: Determining paths for edges to avoid overlaps and reduce crossings.
- Symmetry: Using symmetric layouts for graphs with regular patterns.
- Node Placement: Positioning nodes to make the graph clear and use space efficiently.
These concepts help to choose the right methods for creating effective visualizations.
Force-Directed Graph Layout
The force-directed layout uses the idea of physical forces to arrange the vertices (nodes) and edges. The nodes push away (repel) from each other, while the edges act like springs, pulling the connected nodes closer.
This method is popular because it is simple and works well for most types of graphs.
Planar Graph Drawing
A planar graph drawing ensures that no edges cross each other. This method is used for graphs that can be drawn on a flat surface without any overlapping lines. Algorithms like the Fry embedding or Tutte's algorithm are used to create these types of drawings.
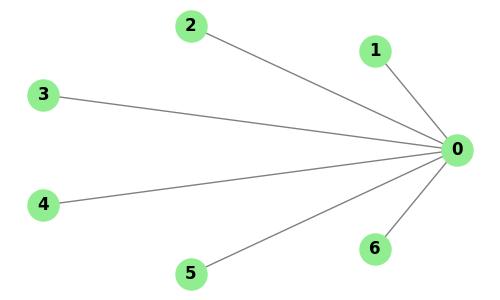
Hierarchical Layout
The hierarchical layout arranges nodes into different levels or layers. It is mostly used for directed acyclic graphs (DAGs) to show relationships or flow. This layout is commonly used in organizational charts and process diagrams.
A DAG (Directed Acyclic Graph) is a type of graph where the edges have a direction, meaning they go from one node to another, and there are no cycles. In other words, you cannot start at one node, follow the edges, and return to the same node.
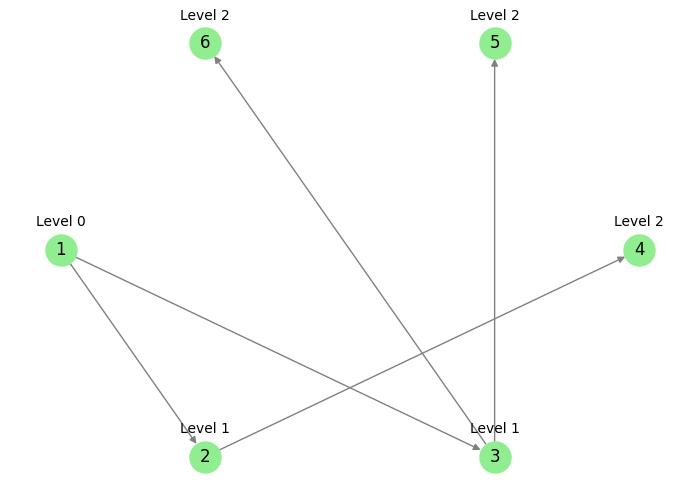
In this image, the levels of the nodes are assigned based on their distance (in terms of hops) from the root node (node 1). The "level" represents how deep a node is in the graph hierarchy, with the root node being at level 0 −
- The root node (1) is at level 0 because it is the starting point.
- Any node directly connected to the root node will be at level 1 (1 hop away from the root).
- Any node that is two edges away from the root will be at level 2, and so on.
Circular Layout
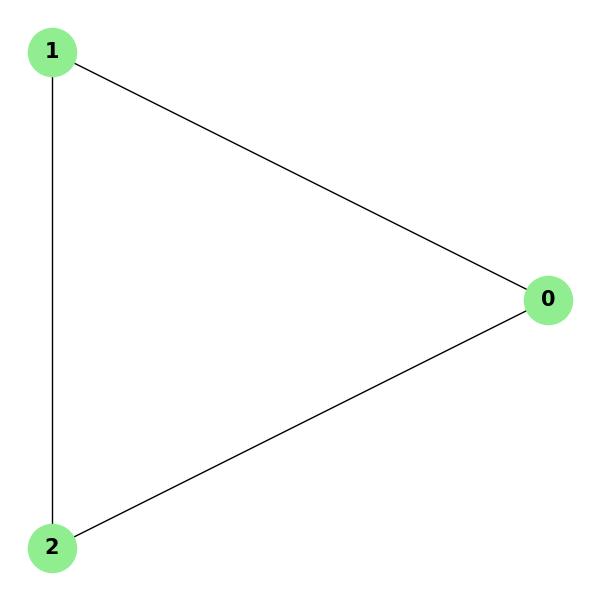
The circular layout arranges nodes in a circle and connects them with edges. It works well for visualizing cycles and networks that have a circular pattern. This layout highlights how the nodes are connected to each other.
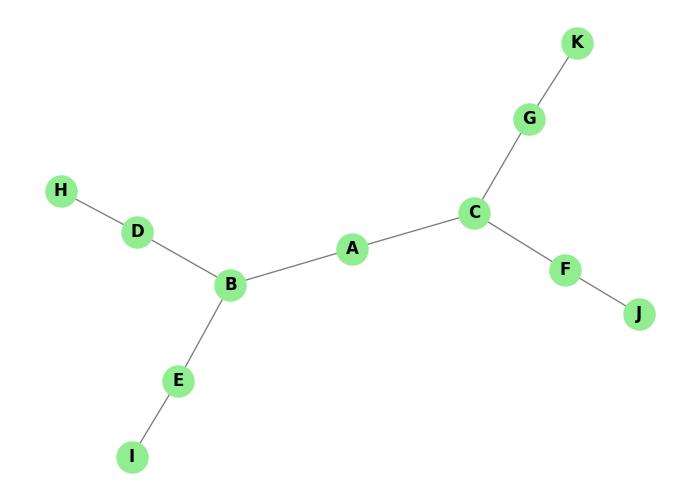
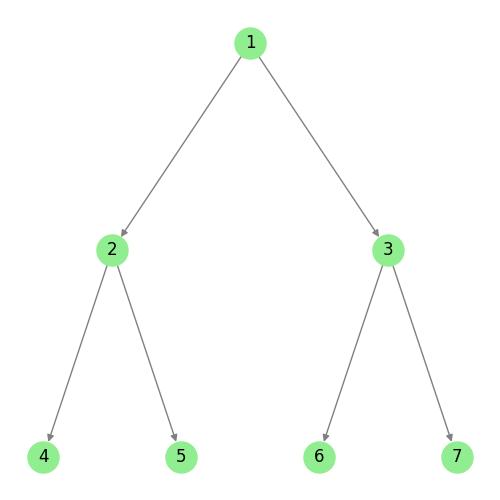
Tree Layout
The tree layout is used for tree graphs, where nodes are arranged in a hierarchy. It starts with a main node (the root) and branches out to other nodes. This layout is often used for things like organizational charts and data that has a clear hierarchy.
Challenges in Graph Drawing
Graph drawing has several challenges due to the complexity of the graph and the need for clear visualization −
- Edge Crossings: It is important to reduce edge crossings so the graph is easy to read, especially for crowded graphs.
- Node Overlaps: Ensuring that nodes do not overlap while keeping them close enough to show their connections.
- Scalability: Drawing large graphs efficiently without losing clarity.
- Symmetry Detection: Identifying and using symmetry to make the graph look more appealing.
- Computational Complexity: Designing layouts for large graphs while minimizing the time and effort needed to create them.
Graph Drawing Using Python
Let us demonstrate graph drawing using the networkx and matplotlib libraries in Python.
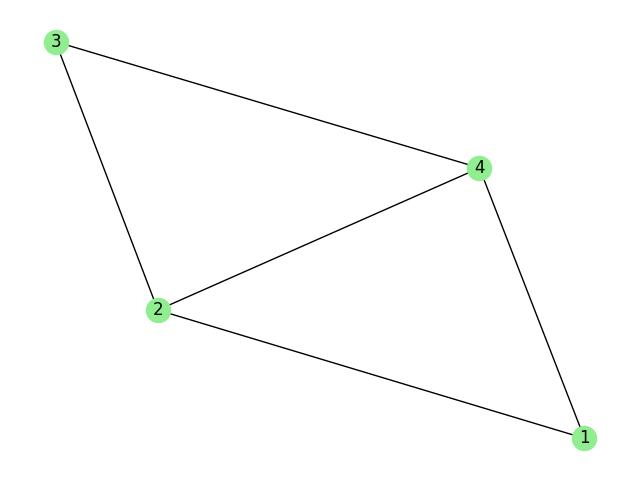
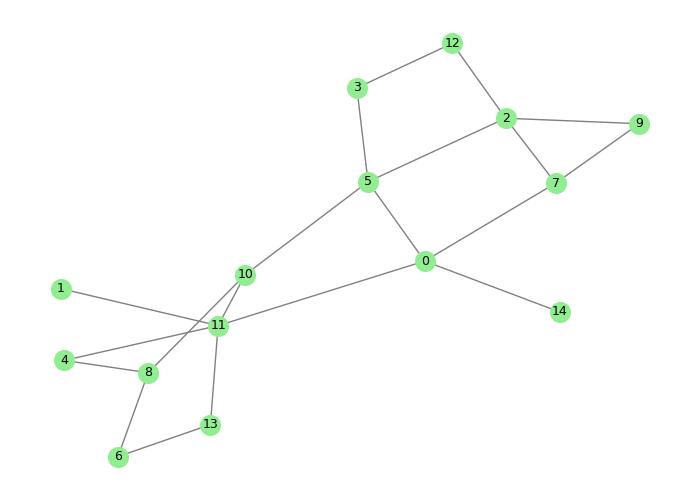
In the following example, we are creating a simple graph and visualizing it using a force-directed layout. The nodes are arranged to minimize edge crossings and achieve a balanced structure −
import networkx as nx
import matplotlib.pyplot as plt

# Create a graph
G = nx.Graph()
G.add_edges_from([(1, 2), (2, 3), (3, 4), (4, 1), (2, 4)])

# Draw the graph using a spring layout
pos = nx.spring_layout(G)  # Force-directed layout
nx.draw(G, pos, with_labels=True, node_color="lightgreen", edge_color="blue")

# Display the graph
plt.title("Force-Directed Graph Drawing")
plt.show()
It produces the following image −