Aptitude - Bar Charts
A bar chart or bar graph is a type of chart to represents Grouped data with rectangular bars where lengths of rectangles/bars are proportional to the values that they represent. The bars can be plotted/drawn vertically or horizontally. A vertical bar chart is also called a column bar chart.
A bar graph uses either horizontal or vertical bars. It is used to show comparisons among categories. One axis of the chart shows the specific categories which are to be compared, and the other axis represents a discrete data set.
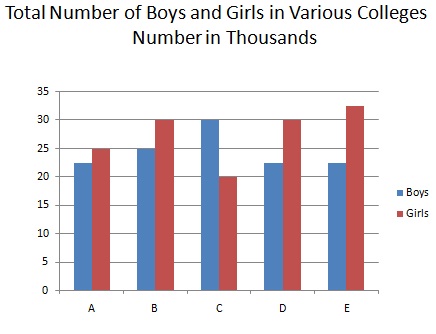
For example, using the above bar chart, you want to check the difference between total number of girls and bodys in all colleges together?
Total number of boys = (22.5+25+30+22.5+22.5) thousands =(122.5*1000) = 122500
Total number of girls =  (25+30+20+30+32.5) thousand = 137.5*1000 = 137500.
∴   Required difference = (137500-122500)= 15000
Solved Examples
Solved Examplesaptitude_bar_charts.htm

Advertisements