- Selenium - Home
- Selenium - Overview
- Selenium - Components
- Selenium - Automation Testing
- Selenium - Environment Setup
- Selenium - Remote Control
- Selenium - IDE Introduction
- Selenium - Features
- Selenium - Limitations
- Selenium - Installation
- Selenium - Creating Tests
- Selenium - Creating Script
- Selenium - Control Flow
- Selenium - Store Variables
- Selenium - Alerts & Popups
- Selenium - Selenese Commands
- Selenium - Actions Commands
- Selenium - Accessors Commands
- Selenium - Assertions Commands
- Selenium - Assert/Verify Methods
- Selenium - Locating Strategies
- Selenium - Script Debugging
- Selenium - Verification Points
- Selenium - Pattern Matching
- Selenium - JSON Data File
- Selenium - Browser Execution
- Selenium - User Extensions
- Selenium - Code Export
- Selenium - Emitting Code
- Selenium - JavaScript Functions
- Selenium - Plugins
- Selenium WebDriver Tutorial
- Selenium - Introduction
- Selenium WebDriver vs RC
- Selenium - Installation
- Selenium - First Test Script
- Selenium - Driver Sessions
- Selenium - Browser Options
- Selenium - Chrome Options
- Selenium - Edge Options
- Selenium - Firefox Options
- Selenium - Safari Options
- Selenium - Double Click
- Selenium - Right Click
- HTML Report in Python
- Handling Edit Boxes
- Selenium - Single Elements
- Selenium - Multiple Elements
- Selenium Web Elements
- Selenium - File Upload
- Selenium - Locator Strategies
- Selenium - Relative Locators
- Selenium - Finders
- Selenium - Find All Links
- Selenium - User Interactions
- Selenium - WebElement Commands
- Selenium - Browser Interactions
- Selenium - Browser Commands
- Selenium - Browser Navigation
- Selenium - Alerts & Popups
- Selenium - Handling Forms
- Selenium - Windows and Tabs
- Selenium - Handling Links
- Selenium - Input Boxes
- Selenium - Radio Button
- Selenium - Checkboxes
- Selenium - Dropdown Box
- Selenium - Handling IFrames
- Selenium - Handling Cookies
- Selenium - Date Time Picker
- Selenium - Dynamic Web Tables
- Selenium - Actions Class
- Selenium - Action Class
- Selenium - Keyboard Events
- Selenium - Key Up/Down
- Selenium - Copy and Paste
- Selenium - Handle Special Keys
- Selenium - Mouse Events
- Selenium - Drag and Drop
- Selenium - Pen Events
- Selenium - Scroll Operations
- Selenium - Waiting Strategies
- Selenium - Explicit/Implicit Wait
- Selenium - Support Features
- Selenium - Multi Select
- Selenium - Wait Support
- Selenium - Select Support
- Selenium - Color Support
- Selenium - ThreadGuard
- Selenium - Errors & Logging
- Selenium - Exception Handling
- Selenium - Miscellaneous
- Selenium - Handling Ajax Calls
- Selenium - JSON Data File
- Selenium - CSV Data File
- Selenium - Excel Data File
- Selenium - Cross Browser Testing
- Selenium - Multi Browser Testing
- Selenium - Multi Windows Testing
- Selenium - JavaScript Executor
- Selenium - Headless Execution
- Selenium - Capture Screenshots
- Selenium - Capture Videos
- Selenium - Page Object Model
- Selenium - Page Factory
- Selenium - Record & Playback
- Selenium - Frameworks
- Selenium - Browsing Context
- Selenium - DevTools
- Selenium Grid Tutorial
- Selenium - Overview
- Selenium - Architecture
- Selenium - Components
- Selenium - Configuration
- Selenium - Create Test Script
- Selenium - Test Execution
- Selenium - Endpoints
- Selenium - Customizing a Node
- Selenium Reporting Tools
- Selenium - Reporting Tools
- Selenium - TestNG
- Selenium - JUnit
- Selenium - Allure
- Selenium & Other Technologies
- Selenium - Java Tutorial
- Selenium - Python Tutorial
- Selenium - C# Tutorial
- Selenium - Javascript Tutorial
- Selenium - Kotlin Tutorial
- Selenium - Ruby Tutorial
- Selenium - Maven & Jenkins
- Selenium - LogExpert Logging
- Selenium - Log4j Logging
- Selenium - Robot Framework
- Selenium - Github Tutorial
- Selenium - IntelliJ
- Selenium - XPath
- Selenium Miscellaneous Concepts
- Selenium - IE Driver
- Selenium - Automation Frameworks
- Selenium - Keyword Driven Framework
- Selenium - Data Driven Framework
- Selenium - Hybrid Driven Framework
- Selenium - SSL Certificate Error
- Selenium - Alternatives
- Selenium Useful Resources
- Selenium - Questions & Answers
- Selenium - Quick Guide
- Selenium - Useful Resources
- Selenium - Automation Practice
- Selenium - Discussion
Selenium IDE - Script Debugging
Selenium IDE provides multiple script debugging options with the help of which we can troubleshoot scripts on failures, or for any other purposes. A debugging of a script is done to ensure that the script should run as it is intended to do by investigating and solving errors, if any.
There are multiple debugging techniques and features available in Selenium IDE.
Step-By-Step Execution
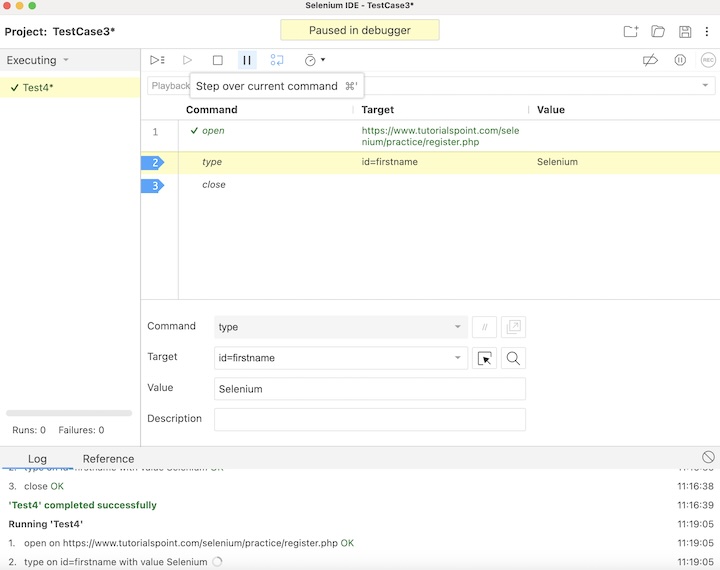
The Step over current command button allows you to run the test step by step and examine if something is not working.
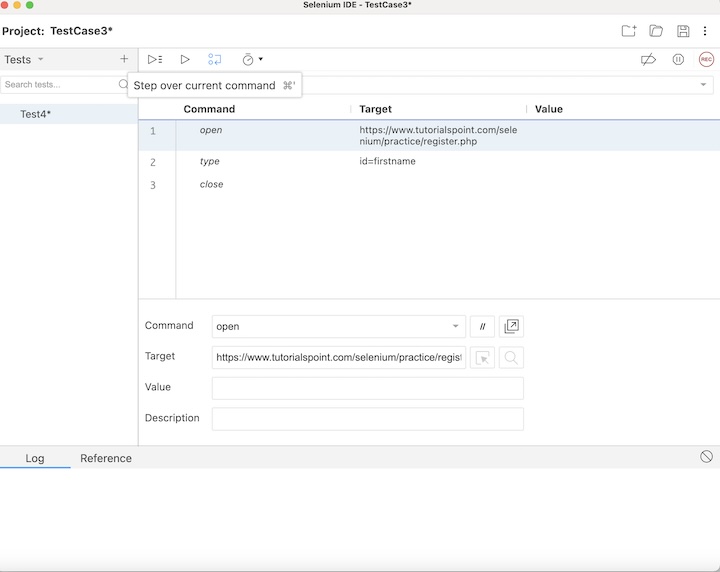
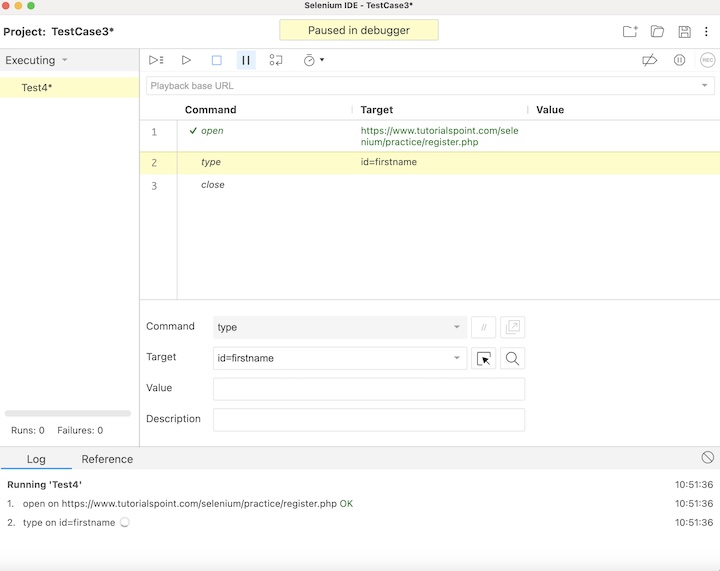
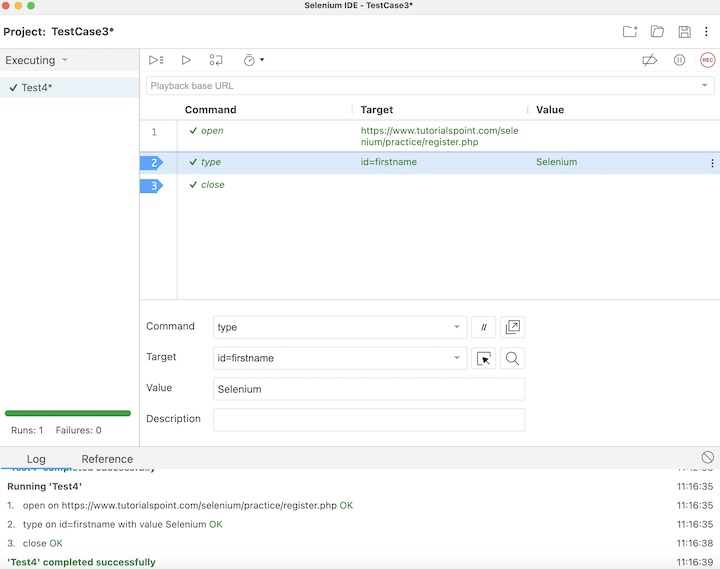
On clicking on this button repeatedly, we can see if any of the test steps are not working as expected. In the below image, the step 1 executed successfully, after we clicked the Step over current command button. Then Paused in debugger appeared along with the next step to be executed(here the step2) became yellow.
In the below image now it shows another button Resume test execution. We can also click on it and re-trigger the execution.
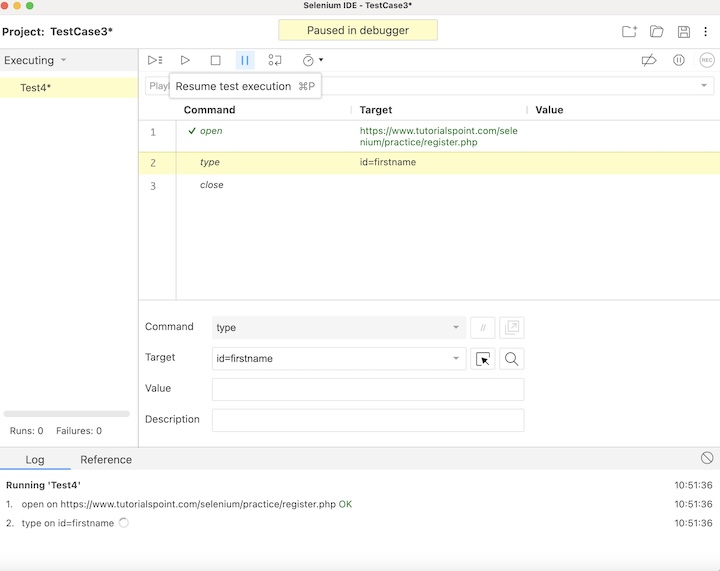
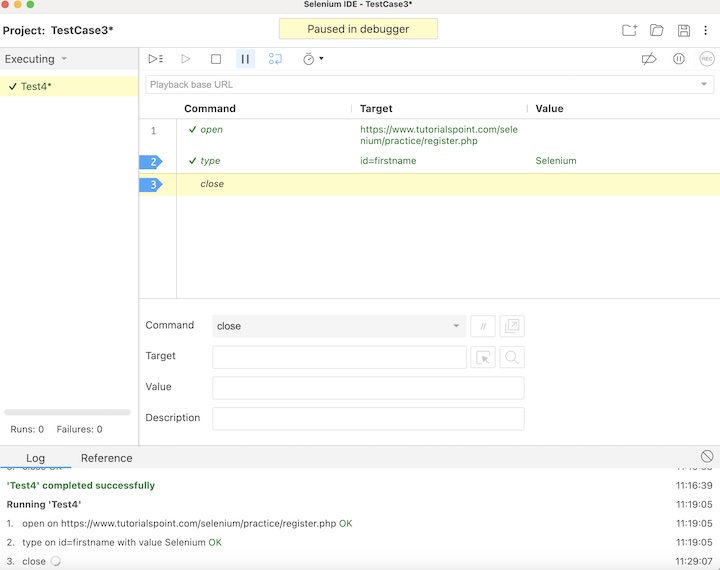
Once again when the Step over current command button is clicked, the step2 will be executed, and so on.
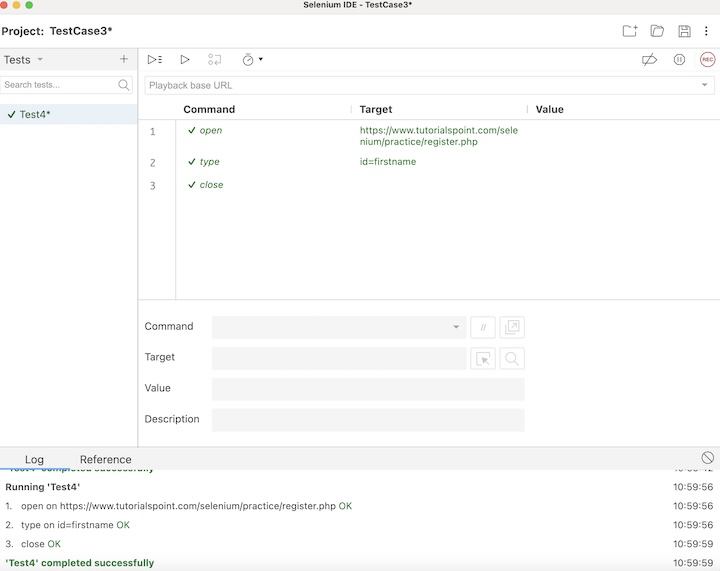
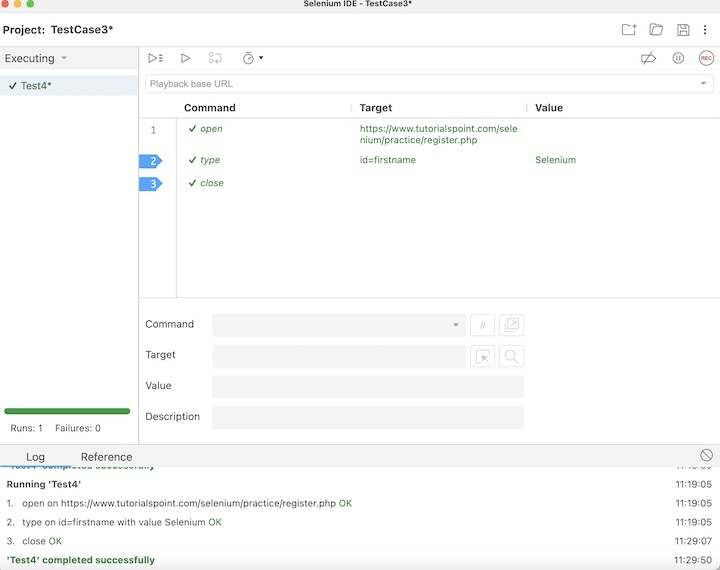
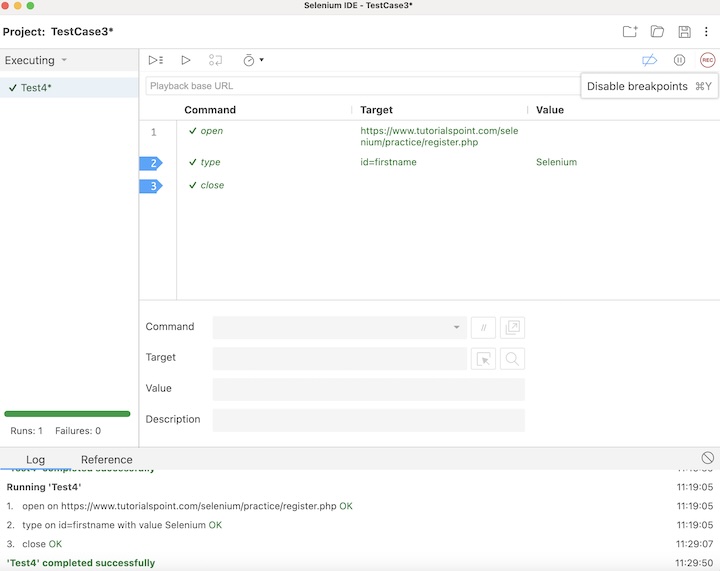
As the execution has been completed, we would get the message of the result. In case the test passed, we would get the message - <TEST NAME> completed successfully under the Log tab at the bottom of the Selenium IDE. Here, our test name is Test4, hence received the message - Test4 completed successfully.
Apart from that, all the test steps, along with the test case name turned green, reflecting a PASS for all the steps. All the steps which reflected under the Log tab, showed an OK in green.
Adding Breakpoints
We can click on the line numbers in the test to add breakpoints in order to debug test steps in Selenium IDE. In the below image, we have added breakpoints to line numbers 2, and 3 (highlighted in blue in Selenium IDE).
After which, when we run the test, the execution will first automatically stop in line 2. Then the Paused in debugger appeared along with the next step to be executed (here the step2) becomes yellow.
We will click again on the Step over current command button which will help us to continue with the next step of execution.
The same process will be repeated, once we move to the next step.
Once the execution would be completed, we would get the message of the result. In case the test passed, we would get the message - <TEST NAME> completed successfully under the Log tab at the bottom of the Selenium IDE. Here, our test name is Test4, hence received the message - Test4 completed successfully.
Apart from that, all the test steps, along with the test case name turned green, reflecting a PASS for all the steps. All the steps which reflected under the Log tab, showed an OK in green.
We can disable all the breakpoints by clicking the Disable breakpoints button. All breakpoints would get enabled on clicking the same button again.
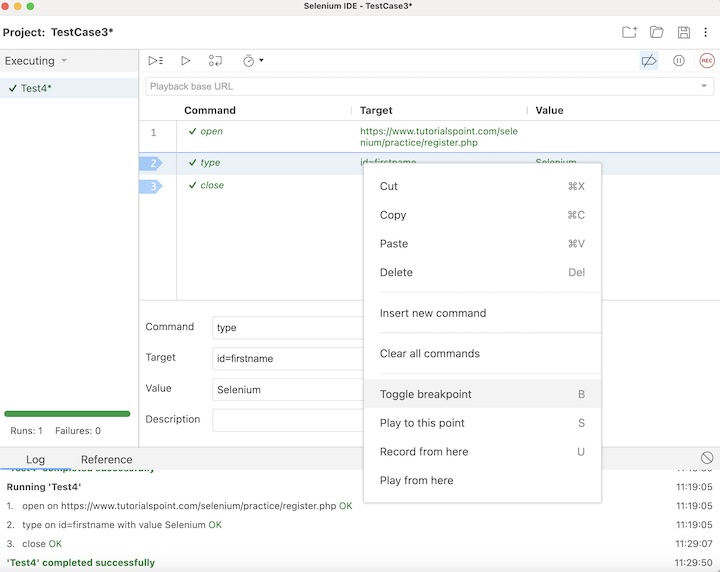
The breakpoints can also be removed/added to steps by right clicking on any step, and selecting the option Toggle Breakpoint.
Debugger Command
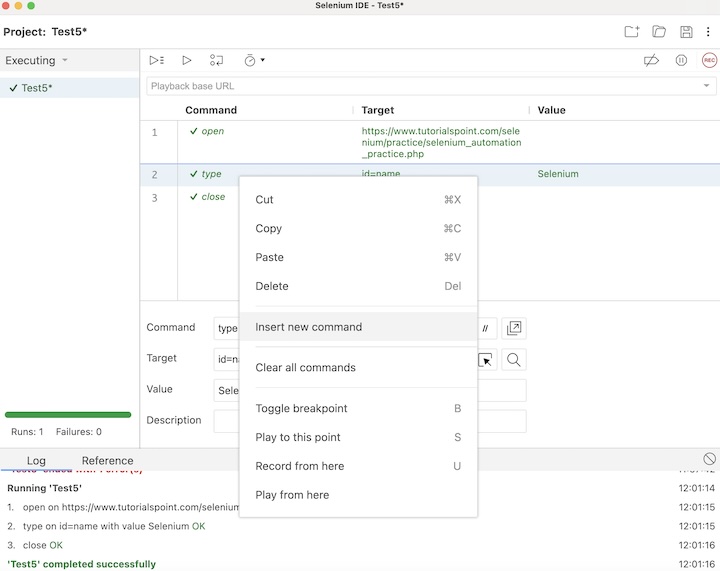
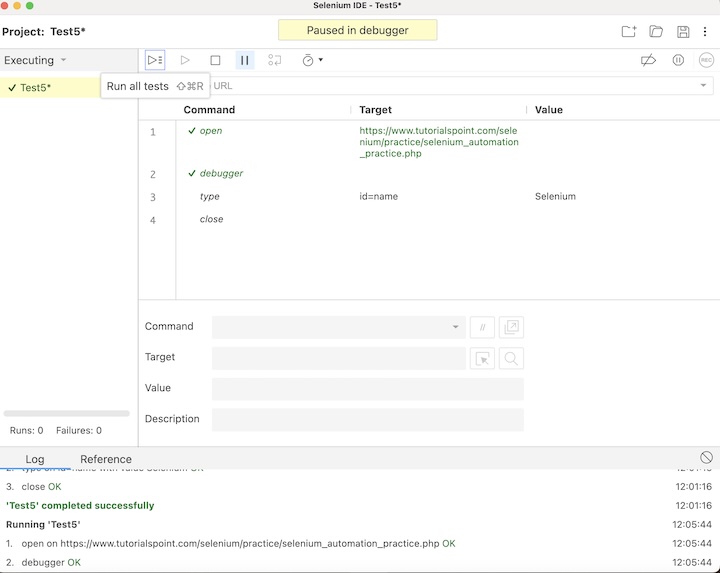
We can programmatically pause Selenium IDE tests by using the JavaScript command debugger. We would need to right click on a step and select the option Insert new command.
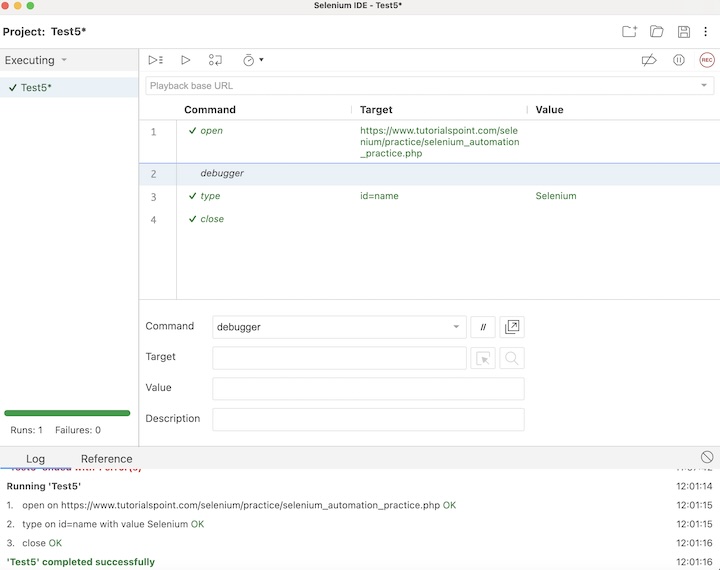
Enter debugger in the Command field to pause the execution.
Once the test execution is triggered, the control will stop in the debugger step and we will need to resume execution using the Resume test execution button. Then the Paused in debugger along with the test name would become yellow.
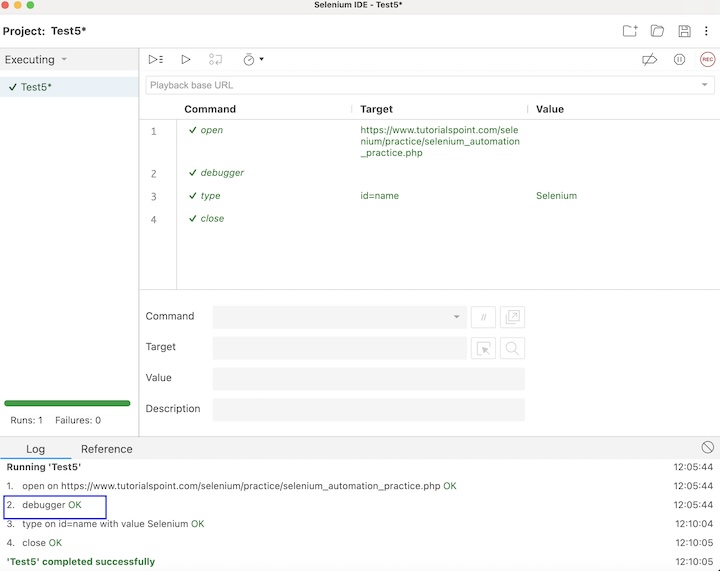
Once the execution would be completed, we would get the message of the result. In case the test passed, we would get the message - <TEST NAME> completed successfully under the Log tab at the bottom of the Selenium IDE. Here, our test name is Test5, hence received the message - Test5 completed successfully.
Apart from that, all the test steps, along with the test case name turned green, reflecting a PASS for all the steps. All the steps which reflected under the Log tab, showed an OK in green.
Pause on Exceptions
The Pause on Exception feature in Selenium IDE helps to pause the exception of a test in case an error is encountered. Once paused, we can rectify the step and resume execution.
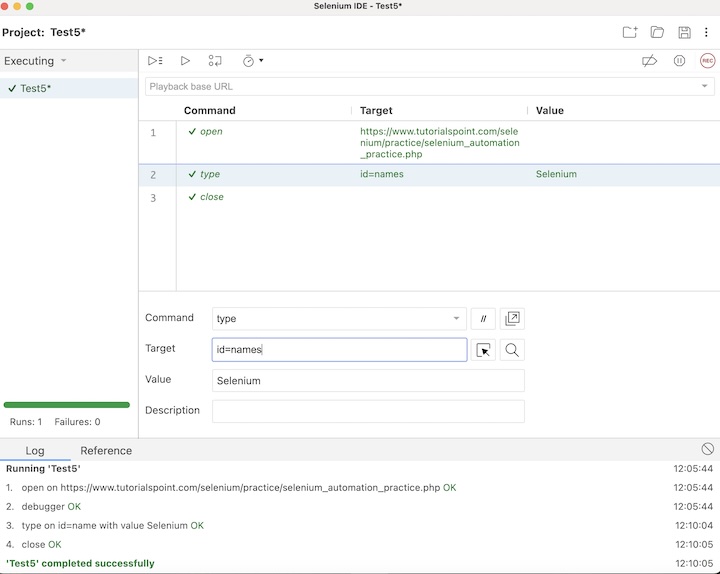
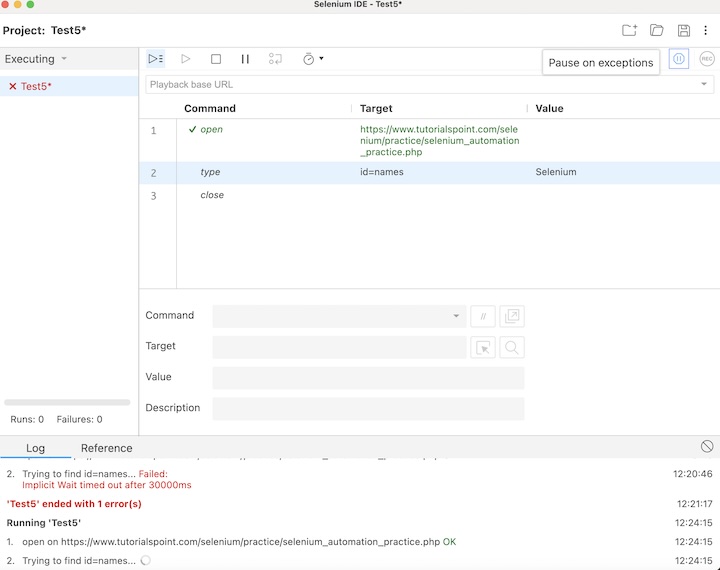
Let us take the example discussed previously, and intentionally we would fail a step in that test case, by changing the locator id value in line 2. Here, we have changed the locator value to id=names.
Once the execution is completed, we would get the failed test and the rest of the test steps after the failed step would not get executed.
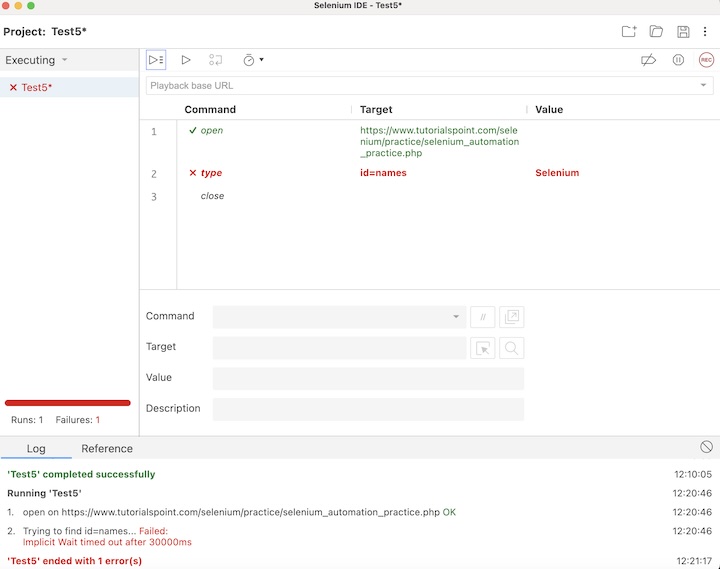
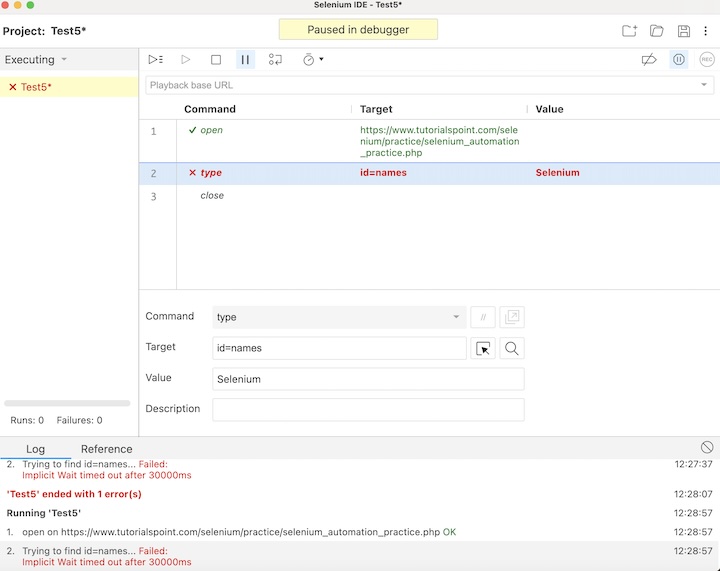
However, to prevent the execution from being aborted, we would need to click on the Pause on exceptions button, and then run the test again.
In the below image, the execution stopped at line 2 (due to incorrect locator value) with the Paused in debugger along with the test name turning yellow.
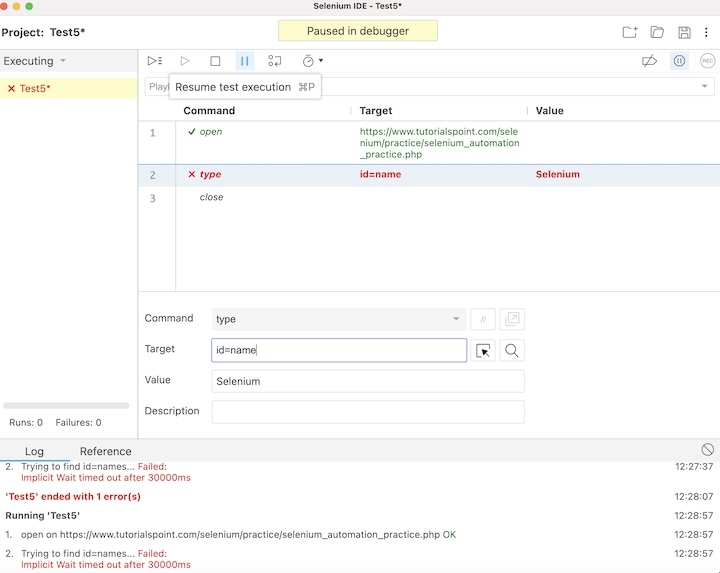
We will correct the locator value from id=names to id=name and again click on the Resume test execution button.
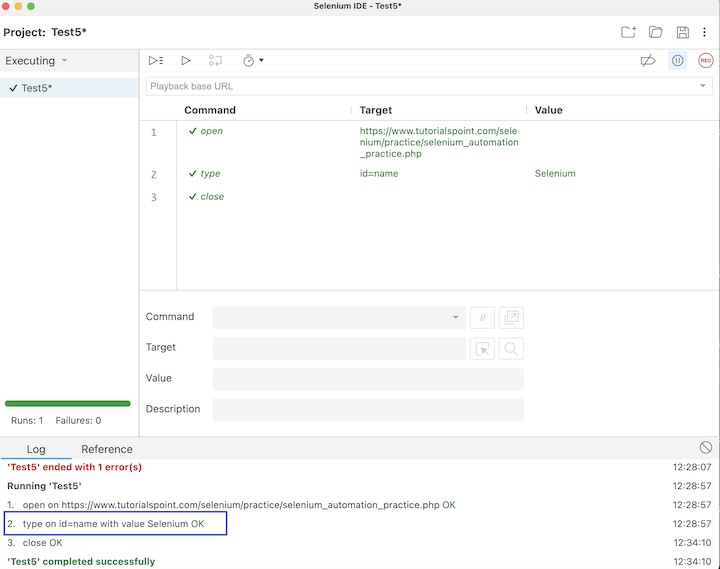
Once the execution would be completed, we would get the message of the result. In case the test passed, we would get the message - <TEST NAME> completed successfully under the Log tab at the bottom of the Selenium IDE. Here, our test name is Test5, hence received the message - Test5 completed successfully.
Apart from that, all the test steps, along with the test case name turned green, reflecting a PASS for all the steps. All the steps which reflected under the Log tab, showed an OK in green.
This concludes our comprehensive take on the tutorial on Selenium IDE - Script Debugging. Weve started with describing an example and walked through the different debugging strategies like the step-by-step execution, adding breakpoints, debugger command, Pause on exceptions, and illustrating how to use them along with Selenium. This equips you with in-depth knowledge of the debugging strategies in Selenium IDE. It is wise to keep practicing what youve learned and exploring others relevant to Selenium to deepen your understanding and expand your horizons.
