- JavaFX - Environment
- JavaFX - Installation Using Netbeans
- JavaFX - Installation Using Eclipse
- JavaFX - Installation using Visual Studio Code
- JavaFX - Architecture
- JavaFX - Application
- JavaFX 2D Shapes
- JavaFX - 2D Shapes
- JavaFX - Drawing a Line
- JavaFX - Drawing a Rectangle
- JavaFX - Drawing a Rounded Rectangle
- JavaFX - Drawing a Circle
- JavaFX - Drawing an Ellipse
- JavaFX - Drawing a Polygon
- JavaFX - Drawing a Polyline
- JavaFX - Drawing a Cubic Curve
- JavaFX - Drawing a Quad Curve
- JavaFX - Drawing an Arc
- JavaFX - Drawing an SVGPath
- JavaFX Properties of 2D Objects
- JavaFX - Stroke Type Property
- JavaFX - Stroke Width Property
- JavaFX - Stroke Fill Property
- JavaFX - Stroke Property
- JavaFX - Stroke Line Join Property
- JavaFX - Stroke Miter Limit Property
- JavaFX - Stroke Line Cap Property
- JavaFX - Smooth Property
- Operations on 2D Objects
- JavaFX - 2D Shapes Operations
- JavaFX - Union Operation
- JavaFX - Intersection Operation
- JavaFX - Subtraction Operation
- JavaFX Path Objects
- JavaFX - Path Objects
- JavaFX - LineTo Path Object
- JavaFX - HLineTo Path Object
- JavaFX - VLineTo Path Object
- JavaFX - QuadCurveTo Path Object
- JavaFX - CubicCurveTo Path Object
- JavaFX - ArcTo Path Object
- JavaFX Color and Texture
- JavaFX - Colors
- JavaFX - Linear Gradient Pattern
- JavaFX - Radial Gradient Pattern
- JavaFX Text
- JavaFX - Text
- JavaFX Effects
- JavaFX - Effects
- JavaFX - Color Adjust Effect
- JavaFX - Color input Effect
- JavaFX - Image Input Effect
- JavaFX - Blend Effect
- JavaFX - Bloom Effect
- JavaFX - Glow Effect
- JavaFX - Box Blur Effect
- JavaFX - GaussianBlur Effect
- JavaFX - MotionBlur Effect
- JavaFX - Reflection Effect
- JavaFX - SepiaTone Effect
- JavaFX - Shadow Effect
- JavaFX - DropShadow Effect
- JavaFX - InnerShadow Effect
- JavaFX - Lighting Effect
- JavaFX - Light.Distant Effect
- JavaFX - Light.Spot Effect
- JavaFX - Point.Spot Effect
- JavaFX - DisplacementMap
- JavaFX - PerspectiveTransform
- JavaFX Transformations
- JavaFX - Transformations
- JavaFX - Rotation Transformation
- JavaFX - Scaling Transformation
- JavaFX - Translation Transformation
- JavaFX - Shearing Transformation
- JavaFX Animations
- JavaFX - Animations
- JavaFX - Rotate Transition
- JavaFX - Scale Transition
- JavaFX - Translate Transition
- JavaFX - Fade Transition
- JavaFX - Fill Transition
- JavaFX - Stroke Transition
- JavaFX - Sequential Transition
- JavaFX - Parallel Transition
- JavaFX - Pause Transition
- JavaFX - Path Transition
- JavaFX Images
- JavaFX - Images
- JavaFX 3D Shapes
- JavaFX - 3D Shapes
- JavaFX - Creating a Box
- JavaFX - Creating a Cylinder
- JavaFX - Creating a Sphere
- Properties of 3D Objects
- JavaFX - Cull Face Property
- JavaFX - Drawing Modes Property
- JavaFX - Material Property
- JavaFX Event Handling
- JavaFX - Event Handling
- JavaFX - Using Convenience Methods
- JavaFX - Event Filters
- JavaFX - Event Handlers
- JavaFX UI Controls
- JavaFX - UI Controls
- JavaFX - ListView
- JavaFX - Accordion
- JavaFX - ButtonBar
- JavaFX - ChoiceBox
- JavaFX - HTMLEditor
- JavaFX - MenuBar
- JavaFX - Pagination
- JavaFX - ProgressIndicator
- JavaFX - ScrollPane
- JavaFX - Separator
- JavaFX - Slider
- JavaFX - Spinner
- JavaFX - SplitPane
- JavaFX - TableView
- JavaFX - TabPane
- JavaFX - ToolBar
- JavaFX - TreeView
- JavaFX - Label
- JavaFX - CheckBox
- JavaFX - RadioButton
- JavaFX - TextField
- JavaFX - PasswordField
- JavaFX - FileChooser
- JavaFX - Hyperlink
- JavaFX - Tooltip
- JavaFX - Alert
- JavaFX - DatePicker
- JavaFX - TextArea
- JavaFX Charts
- JavaFX - Charts
- JavaFX - Creating Pie Chart
- JavaFX - Creating Line Chart
- JavaFX - Creating Area Chart
- JavaFX - Creating Bar Chart
- JavaFX - Creating Bubble Chart
- JavaFX - Creating Scatter Chart
- JavaFX - Creating Stacked Area Chart
- JavaFX - Creating Stacked Bar Chart
- JavaFX Layout Panes
- JavaFX - Layout Panes
- JavaFX - HBox Layout
- JavaFX - VBox Layout
- JavaFX - BorderPane Layout
- JavaFX - StackPane Layout
- JavaFX - TextFlow Layout
- JavaFX - AnchorPane Layout
- JavaFX - TilePane Layout
- JavaFX - GridPane Layout
- JavaFX - FlowPane Layout
- JavaFX CSS
- JavaFX - CSS
- Media with JavaFX
- JavaFX - Handling Media
- JavaFX - Playing Video
- JavaFX Useful Resources
- JavaFX - Quick Guide
- JavaFX - Useful Resources
- JavaFX - Discussion
JavaFX - Stacked Bar Chart
StackedBarChart is a variation of a BarChart, which plots bars indicating data values for a category. The bars can be vertical or horizontal depending on which axis is the category axis. The bar for each series is stacked on top of the previous series.
The following is a Stacked Bar Chart, which depicts the population growth.
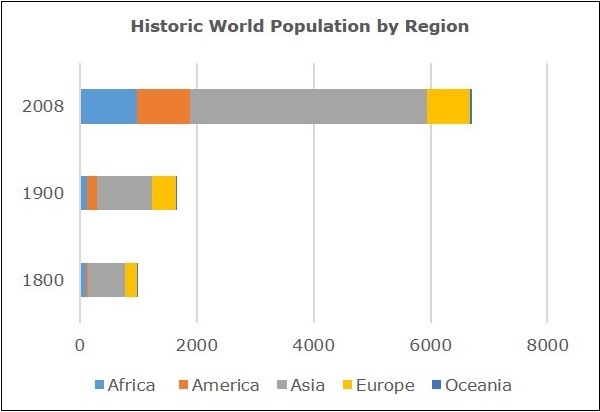
Stacked Bar Chart in JavaFX
In JavaFX, a Stacked Bar Chart is represented by a class named StackedBarChart. This class belongs to the package javafx.scene.chart. By instantiating this class, you can create a StackedBarChart node in JavaFX.
To generate a Stacked Bar Chart in JavaFX, follow the steps given below.
Step 1: Defining the Axis
Define the X and Y axis of the stacked bar chart and set labels to them. In our example, X axis represents the continents and the y axis represents the population in millions.
public class ClassName extends Application {
   @Override
   public void start(Stage primaryStage) throws Exception {
      //Defining the x axis
      CategoryAxis xAxis = new CategoryAxis();

      xAxis.setCategories(FXCollections.<String>observableArrayList(Arrays.asList
      ("Africa", "America", "Asia", "Europe", "Oceania")));
      xAxis.setLabel("category");

      //Defining the y axis
      NumberAxis yAxis = new NumberAxis();
      yAxis.setLabel("Population (In millions)");
   }
}
Step 2: Creating the Stacked Bar Chart
Create a line chart by instantiating the class named StackedBarChart of the package javafx.scene.chart. To the constructor of this class, pass the objects representing the X and Y axis created in the previous step.
//Creating the Bar chart
StackedBarChart<String, Number> stackedBarChart =
new StackedBarChart<>(xAxis, yAxis);
stackedBarChart.setTitle("Historic World Population by Region");
Step 3: Preparing the Data
Instantiate the XYChart.Series class and add the data (a series of, x and y coordinates) to the Observable list of this class as follows −
//Prepare XYChart.Series objects by setting data
XYChart.Series<String, Number> series1 = new XYChart.Series<>();
series1.setName("1800");
series1.getData().add(new XYChart.Data<>("Africa", 107));
series1.getData().add(new XYChart.Data<>("America", 31));
series1.getData().add(new XYChart.Data<>("Asia", 635));
series1.getData().add(new XYChart.Data<>("Europe", 203));
series1.getData().add(new XYChart.Data<>("Oceania", 2));
XYChart.Series<String, Number> series2 = new XYChart.Series<>();

series2.setName("1900");
series2.getData().add(new XYChart.Data<>("Africa", 133));
series2.getData().add(new XYChart.Data<>("America", 156));
series2.getData().add(new XYChart.Data<>("Asia", 947));
series2.getData().add(new XYChart.Data<>("Europe", 408));
series1.getData().add(new XYChart.Data<>("Oceania", 6));

XYChart.Series<String, Number> series3 = new XYChart.Series<>();
series3.setName("2008");
series3.getData().add(new XYChart.Data<>("Africa", 973));
series3.getData().add(new XYChart.Data<>("America", 914));
series3.getData().add(new XYChart.Data<>("Asia", 4054));
series3.getData().add(new XYChart.Data<>("Europe", 732));
series1.getData().add(new XYChart.Data<>("Oceania", 34));
Step 4: Add Data to the Stacked Bar Chart
Add the data series prepared in the previous step to the bar chart as follows −
//Setting the data to bar chart
stackedBarChart.getData().addAll(series1, series2, series3);
Step 5: Creating a Group Object
In the start() method, create a group object by instantiating the class named Group. This belongs to the package javafx.scene.
Pass the StackedBarChart (node) object created in the previous step as a parameter to the constructor of the Group class. This should be done in order to add it to the group as follows −
Group root = new Group(stackedBarChart);
Step 6: Launching Application
Lastly, follow the given steps below to launch the application properly −
Firstly, instantiate the class named Scene by passing the Group object as a parameter value to its constructor. To this constructor, you can also pass dimensions of the application screen as optional parameters.
Then, set the title to the stage using the setTitle() method of the Stage class.
Now, a Scene object is added to the stage using the setScene() method of the class named Stage.
Display the contents of the scene using the method named show().
Lastly, the application is launched with the help of the launch() method.
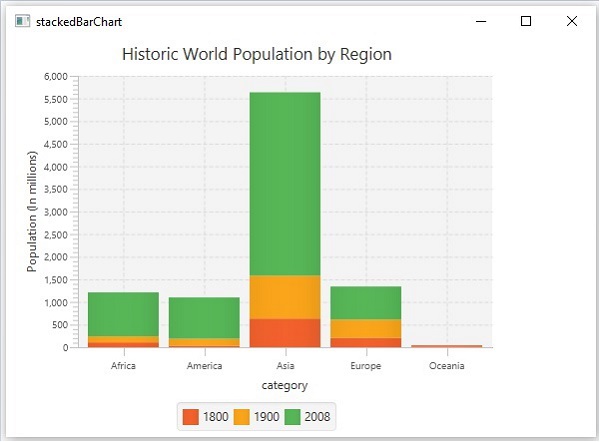
Example
The following table lists out the population in various continents in the years 1800, 1900 and 2008.
| Africa | America | Asia | Europe | Oceania | |
|---|---|---|---|---|---|
| 1800 | 107 | 31 | 635 | 203 | 2 |
| 1900 | 133 | 156 | 947 | 408 | 6 |
| 2008 | 973 | 914 | 4054 | 732 | 34 |
Following is a Java program that generates a stacked bar chart depicting the above data, using JavaFX.
Save this code in a file with the name StackedBarChartExample.java.
import java.util.Arrays;
import javafx.application.Application;
import javafx.collections.FXCollections;
import javafx.scene.Group;
import javafx.scene.Scene;
import javafx.scene.chart.CategoryAxis;
import javafx.stage.Stage;
import javafx.scene.chart.NumberAxis;
import javafx.scene.chart.StackedBarChart;
import javafx.scene.chart.XYChart;

public class StackedBarChartExample extends Application {
   @Override
   public void start(Stage stage) {
      //Defining the axes
      CategoryAxis xAxis = new CategoryAxis();
      xAxis.setCategories(FXCollections.<String>observableArrayList(Arrays.asList
         ("Africa", "America", "Asia", "Europe", "Oceania")));

      xAxis.setLabel("category");
      NumberAxis yAxis = new NumberAxis();
      yAxis.setLabel("Population (In millions)");

      //Creating the Bar chart
      StackedBarChart<String, Number> stackedBarChart =
         new StackedBarChart<>(xAxis, yAxis);
      stackedBarChart.setTitle("Historic World Population by Region");

      //Prepare XYChart.Series objects by setting data
      XYChart.Series<String, Number> series1 = new XYChart.Series<>();
      series1.setName("1800");
      series1.getData().add(new XYChart.Data<>("Africa", 107));
      series1.getData().add(new XYChart.Data<>("America", 31));
      series1.getData().add(new XYChart.Data<>("Asia", 635));
      series1.getData().add(new XYChart.Data<>("Europe", 203));
      series1.getData().add(new XYChart.Data<>("Oceania", 2));

      XYChart.Series<String, Number> series2 = new XYChart.Series<>();
      series2.setName("1900");
      series2.getData().add(new XYChart.Data<>("Africa", 133));
      series2.getData().add(new XYChart.Data<>("America", 156));
      series2.getData().add(new XYChart.Data<>("Asia", 947));
      series2.getData().add(new XYChart.Data<>("Europe", 408));
      series1.getData().add(new XYChart.Data<>("Oceania", 6));

      XYChart.Series<String, Number> series3 = new XYChart.Series<>();
      series3.setName("2008");
      series3.getData().add(new XYChart.Data<>("Africa", 973));
      series3.getData().add(new XYChart.Data<>("America", 914));
      series3.getData().add(new XYChart.Data<>("Asia", 4054));
      series3.getData().add(new XYChart.Data<>("Europe", 732));
      series1.getData().add(new XYChart.Data<>("Oceania", 34));

      //Setting the data to bar chart
      stackedBarChart.getData().addAll(series1, series2, series3);

      //Creating a Group object
      Group root = new Group(stackedBarChart);

      //Creating a scene object
      Scene scene = new Scene(root, 600, 400);

      //Setting title to the Stage
      stage.setTitle("stackedBarChart");

      //Adding scene to the stage
      stage.setScene(scene);

      //Displaying the contents of the stage
      stage.show();
   }
   public static void main(String args[]){
      launch(args);
   }
}
Compile and execute the saved java file from the command prompt using the following commands.
javac --module-path %PATH_TO_FX% --add-modules javafx.controls StackedBarChartExample.java
java --module-path %PATH_TO_FX% --add-modules javafx.controls StackedBarChartExample
Output
On executing, the above program generates a JavaFX window displaying an area chart as shown below.
Example
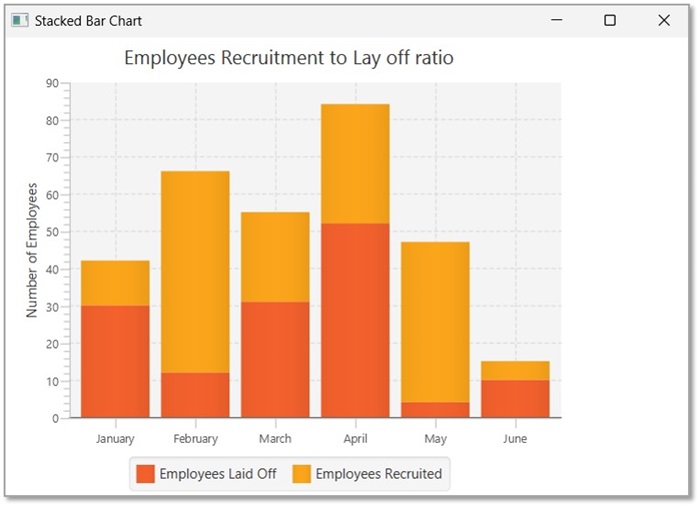
The following table depicts the data of employees laid off and recruited in an organization, in the first quarter of an year.
| Month | Employees Laid Off | Employees Recruited |
|---|---|---|
| January | 30 | 12 |
| February | 12 | 54 |
| March | 31 | 24 |
| April | 52 | 32 |
| May | 4 | 43 |
| June | 10 | 5 |
Following is a Java program that generates a stacked bar chart depicting the above data, using JavaFX.
Save this code in a file with the name StackedBarChartEmployees.java.
import javafx.application.Application;
import javafx.scene.Group;
import javafx.scene.Scene;
import javafx.scene.chart.StackedBarChart;
import javafx.scene.chart.CategoryAxis;
import javafx.stage.Stage;
import javafx.scene.chart.NumberAxis;
import javafx.scene.chart.XYChart;

public class StackedBarChartEmployees extends Application {
   @Override
   public void start(Stage stage) {
      //Defining the X axis
      CategoryAxis xAxis = new CategoryAxis();

      //defining the y Axis
      NumberAxis yAxis = new NumberAxis();
      yAxis.setLabel("Number of Employees");

      //Creating the Area chart
      StackedBarChart stackedbarChart = new StackedBarChart(xAxis, yAxis);
      stackedbarChart.setTitle("Employees Recruitment to Lay off ratio");

      //Prepare XYChart.Series objects by setting data
      XYChart.Series series1 = new XYChart.Series();
      series1.setName("Employees Laid Off");
      series1.getData().add(new XYChart.Data("January", 30));
      series1.getData().add(new XYChart.Data("February", 12));
      series1.getData().add(new XYChart.Data("March", 31));
      series1.getData().add(new XYChart.Data("April", 52));
      series1.getData().add(new XYChart.Data("May", 4));
      series1.getData().add(new XYChart.Data("June", 10));

      XYChart.Series series2 = new XYChart.Series();
      series2.setName("Employees Recruited");
      series2.getData().add(new XYChart.Data("January", 12));
      series2.getData().add(new XYChart.Data("February", 54));
      series2.getData().add(new XYChart.Data("March", 24));
      series2.getData().add(new XYChart.Data("April", 32));
      series2.getData().add(new XYChart.Data("May", 43));
      series2.getData().add(new XYChart.Data("June", 5));

      //Setting the XYChart.Series objects to stacked bar chart
      stackedbarChart.getData().addAll(series1,series2);

      //Creating a Group object
      Group root = new Group(stackedbarChart);

      //Creating a scene object
      Scene scene = new Scene(root, 600, 400);

      //Setting title to the Stage
      stage.setTitle("Stacked Bar Chart");

      //Adding scene to the stage
      stage.setScene(scene);

      //Displaying the contents of the stage
      stage.show();
   }
   public static void main(String args[]){
      launch(args);
   }
}
Compile and execute the saved java file from the command prompt using the following commands.
javac --module-path %PATH_TO_FX% --add-modules javafx.controls StackedBarChartEmployees.java
java --module-path %PATH_TO_FX% --add-modules javafx.controls StackedBarChartEmployees
Output
On executing, the above program generates a JavaFX window displaying an area chart as shown below.