- JavaFX - Environment
- JavaFX - Installation Using Netbeans
- JavaFX - Installation Using Eclipse
- JavaFX - Installation using Visual Studio Code
- JavaFX - Architecture
- JavaFX - Application
- JavaFX 2D Shapes
- JavaFX - 2D Shapes
- JavaFX - Drawing a Line
- JavaFX - Drawing a Rectangle
- JavaFX - Drawing a Rounded Rectangle
- JavaFX - Drawing a Circle
- JavaFX - Drawing an Ellipse
- JavaFX - Drawing a Polygon
- JavaFX - Drawing a Polyline
- JavaFX - Drawing a Cubic Curve
- JavaFX - Drawing a Quad Curve
- JavaFX - Drawing an Arc
- JavaFX - Drawing an SVGPath
- JavaFX Properties of 2D Objects
- JavaFX - Stroke Type Property
- JavaFX - Stroke Width Property
- JavaFX - Stroke Fill Property
- JavaFX - Stroke Property
- JavaFX - Stroke Line Join Property
- JavaFX - Stroke Miter Limit Property
- JavaFX - Stroke Line Cap Property
- JavaFX - Smooth Property
- Operations on 2D Objects
- JavaFX - 2D Shapes Operations
- JavaFX - Union Operation
- JavaFX - Intersection Operation
- JavaFX - Subtraction Operation
- JavaFX Path Objects
- JavaFX - Path Objects
- JavaFX - LineTo Path Object
- JavaFX - HLineTo Path Object
- JavaFX - VLineTo Path Object
- JavaFX - QuadCurveTo Path Object
- JavaFX - CubicCurveTo Path Object
- JavaFX - ArcTo Path Object
- JavaFX Color and Texture
- JavaFX - Colors
- JavaFX - Linear Gradient Pattern
- JavaFX - Radial Gradient Pattern
- JavaFX Text
- JavaFX - Text
- JavaFX Effects
- JavaFX - Effects
- JavaFX - Color Adjust Effect
- JavaFX - Color input Effect
- JavaFX - Image Input Effect
- JavaFX - Blend Effect
- JavaFX - Bloom Effect
- JavaFX - Glow Effect
- JavaFX - Box Blur Effect
- JavaFX - GaussianBlur Effect
- JavaFX - MotionBlur Effect
- JavaFX - Reflection Effect
- JavaFX - SepiaTone Effect
- JavaFX - Shadow Effect
- JavaFX - DropShadow Effect
- JavaFX - InnerShadow Effect
- JavaFX - Lighting Effect
- JavaFX - Light.Distant Effect
- JavaFX - Light.Spot Effect
- JavaFX - Point.Spot Effect
- JavaFX - DisplacementMap
- JavaFX - PerspectiveTransform
- JavaFX Transformations
- JavaFX - Transformations
- JavaFX - Rotation Transformation
- JavaFX - Scaling Transformation
- JavaFX - Translation Transformation
- JavaFX - Shearing Transformation
- JavaFX Animations
- JavaFX - Animations
- JavaFX - Rotate Transition
- JavaFX - Scale Transition
- JavaFX - Translate Transition
- JavaFX - Fade Transition
- JavaFX - Fill Transition
- JavaFX - Stroke Transition
- JavaFX - Sequential Transition
- JavaFX - Parallel Transition
- JavaFX - Pause Transition
- JavaFX - Path Transition
- JavaFX Images
- JavaFX - Images
- JavaFX 3D Shapes
- JavaFX - 3D Shapes
- JavaFX - Creating a Box
- JavaFX - Creating a Cylinder
- JavaFX - Creating a Sphere
- Properties of 3D Objects
- JavaFX - Cull Face Property
- JavaFX - Drawing Modes Property
- JavaFX - Material Property
- JavaFX Event Handling
- JavaFX - Event Handling
- JavaFX - Using Convenience Methods
- JavaFX - Event Filters
- JavaFX - Event Handlers
- JavaFX UI Controls
- JavaFX - UI Controls
- JavaFX - ListView
- JavaFX - Accordion
- JavaFX - ButtonBar
- JavaFX - ChoiceBox
- JavaFX - HTMLEditor
- JavaFX - MenuBar
- JavaFX - Pagination
- JavaFX - ProgressIndicator
- JavaFX - ScrollPane
- JavaFX - Separator
- JavaFX - Slider
- JavaFX - Spinner
- JavaFX - SplitPane
- JavaFX - TableView
- JavaFX - TabPane
- JavaFX - ToolBar
- JavaFX - TreeView
- JavaFX - Label
- JavaFX - CheckBox
- JavaFX - RadioButton
- JavaFX - TextField
- JavaFX - PasswordField
- JavaFX - FileChooser
- JavaFX - Hyperlink
- JavaFX - Tooltip
- JavaFX - Alert
- JavaFX - DatePicker
- JavaFX - TextArea
- JavaFX Charts
- JavaFX - Charts
- JavaFX - Creating Pie Chart
- JavaFX - Creating Line Chart
- JavaFX - Creating Area Chart
- JavaFX - Creating Bar Chart
- JavaFX - Creating Bubble Chart
- JavaFX - Creating Scatter Chart
- JavaFX - Creating Stacked Area Chart
- JavaFX - Creating Stacked Bar Chart
- JavaFX Layout Panes
- JavaFX - Layout Panes
- JavaFX - HBox Layout
- JavaFX - VBox Layout
- JavaFX - BorderPane Layout
- JavaFX - StackPane Layout
- JavaFX - TextFlow Layout
- JavaFX - AnchorPane Layout
- JavaFX - TilePane Layout
- JavaFX - GridPane Layout
- JavaFX - FlowPane Layout
- JavaFX CSS
- JavaFX - CSS
- Media with JavaFX
- JavaFX - Handling Media
- JavaFX - Playing Video
- JavaFX Useful Resources
- JavaFX - Quick Guide
- JavaFX - Useful Resources
- JavaFX - Discussion
JavaFX - Charts
In general, a chart is a graphical representation of data. There are various kinds of charts to represent data such as Bar Chart, Pie Chart, Line Chart, Scatter Chart, etc.
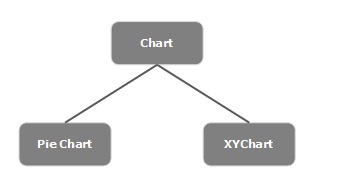
JavaFX Provides support for various Pie Charts and XY Charts. The charts that are represented on an XYplane include AreaChart, BarChart, BubbleChart, LineChart, ScatterChart, StackedAreaChart, StackedBarChart, etc.
Each chart is represented by a class and all these charts belongs to the package javafx.scene.chart. The class named Chart is the base class of all the charts in JavaFX and the XYChart is base class of all those charts that are drawn on the XYplane.
Creating a Chart in JavaFX
To create a chart in JavaFX, you need to perform the following steps −
- Define the axis of the chart
- Instantiate the respective class
- Prepare and pass data to the chart
Instantiating the Respective Class
To create a chart, instantiate its respective class. For example, if you want to create a line chart, you need to instantiate the class named LineChart as follows −
LineChart linechart = new LineChart(xAxis, yAxis);
As observed in the above code, while instantiating, you need to pass two objects representing the X and Y axis of the chart respectively.
Defining the Axis
In general, the axis of the charts can be represented by −
- Numbers such as Population, Age and
- Categories such as Days in a Week, Countries.
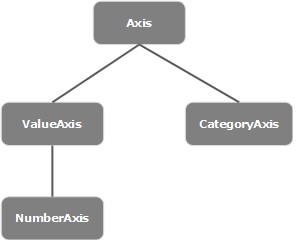
In JavaFX, an axis is an abstract class representing X or Y axis. It has two subclasses to define each type of axis, namely CategoryAxis and NumberAxis as shown in the following diagram −
Category Axis:
By instantiating this class, you can define (create) an X or Y axis along which each value represents a category. You can define a Category axis by instantiating this class as shown below −
CategoryAxis xAxis = new CategoryAxis();
To this axis, you need set the list of categories and label to the axis as shown below −
//setting the list of categories.
xAxis.setCategories(FXCollections.<String>observableArrayList
   (Arrays.asList("n ame1", "name2"....)));

//Setting label to the axis
xAxis.setLabel("name of the axis ");
NumberAxis:
By instantiating this class, you can define (create) an X or Y axis along which each value represents a Numerical value. You can use any Number type with this Axis, Long, Double, BigDecimal, etc. You can define a Number axis by instantiating this class as follows −
//Defining the axis
NumberAxis yAxis = new NumberAxis();

//Setting labelto the axis
yAxis.setLabel("name of the axis");
Passing Data to XY Charts
All the XY charts are represented along the XY plane. To plot a set of points in a chart, we need to specify a series of XY coordinates.
The <X,Y> class of the javafx.scene.chart package is a class using which, you can send data to a chart. This class holds an observable list of named series. You can get this list using the getData() method of XYChart.Series class as shown below −
ObservableList list = series.getData();
Where, series is the object of the XYChart.Series class. You can add data to this list using the add() method as follows −
list.add(new XYChart.Data(x-axis data, y-axis data));
These two lines can be written together as shown below −
series.getData().add(new XYChart.Data(x-axis data, y-axis data));
Types of Charts in JavaFX
The following table gives a description of various charts (classes) provided by JavaFX −
| S.No | Chart & Description |
|---|---|
| 1 | Pie Chart
A pie-chart is a representation of values as slices of a circle with different colors. These slices are labeled and the values corresponding to each slice is represented in the chart. In JavaFX, a pie chart is represented by a class named PieChart. This class belongs to the package javafx.scene.chart. |
| 2 | Line Chart
A line chart or line graph displays information as a series of data points (markers) connected by straight line segments. Line Chart shows how the data changes at equal time frequency. In JavaFX, a line chart is represented by a class named LineChart. This class belongs to the package javafx.scene.chart. By instantiating this class, you can create a LineChart node in JavaFX. |
| 3 | Area Chart
Area charts are used to draw area based charts. It plots the area between the given series of points and the axis. In general, this chart is used to compare two quantities. In JavaFX, an Area chart is represented by a class named AreaChart. This class belongs to the package javafx.scene.chart. By instantiating this class, you can create a AreaChart node in JavaFX. |
| 4 | Bar Chart
A bar chart is used to represent grouped data using rectangular bars. The length of these bars depicts the values. The bars in the bar chart can be plotted vertically or horizontally. In JavaFX, a Bar chart is represented by a class named BarChart. This class belongs to the package javafx.scene.chart. By instantiating this class, you can create a BarChart node in JavaFX. |
| 5 |
Bubble Chart
A bubble chart is used to plat three-dimensional data. The third dimension will be represented by the size (radius) of the bubble. In JavaFX, a Bubble chart is represented by a class named BubbleChart. This class belongs to the package javafx.scene.chart. By instantiating this class, you can create a BubbleChart node in JavaFX. |
| 6 | Scatter Chart
A scatterplot is a type of graph which uses values from two variables plotted in a Cartesian plane. It is usually used to find out the relationship between two variables. In JavaFX, a Scatter chart is represented by a class named ScatterChart. This class belongs to the package javafx.scene.chart. By instantiating this class, you can create a ScatterChart node in JavaFX. |
| 7 | Stacked Area Chart
In JavaFX, a Stacked Area chart is represented by a class named StackedAreaChart. This class belongs to the package javafx.scene.chart. By instantiating this class, you can create an StackedAreaChart node in JavaFX. |
| 8 | Stacked Bar Chart
In JavaFX, a Stacked Bar chart is represented by a class named StackedBarChart. This class belongs to the package javafx.scene.chart. By instantiating this class, you can create a StackedBarChart node in JavaFX. |
