- JavaFX - Environment
- JavaFX - Installation Using Netbeans
- JavaFX - Installation Using Eclipse
- JavaFX - Installation using Visual Studio Code
- JavaFX - Architecture
- JavaFX - Application
- JavaFX 2D Shapes
- JavaFX - 2D Shapes
- JavaFX - Drawing a Line
- JavaFX - Drawing a Rectangle
- JavaFX - Drawing a Rounded Rectangle
- JavaFX - Drawing a Circle
- JavaFX - Drawing an Ellipse
- JavaFX - Drawing a Polygon
- JavaFX - Drawing a Polyline
- JavaFX - Drawing a Cubic Curve
- JavaFX - Drawing a Quad Curve
- JavaFX - Drawing an Arc
- JavaFX - Drawing an SVGPath
- JavaFX Properties of 2D Objects
- JavaFX - Stroke Type Property
- JavaFX - Stroke Width Property
- JavaFX - Stroke Fill Property
- JavaFX - Stroke Property
- JavaFX - Stroke Line Join Property
- JavaFX - Stroke Miter Limit Property
- JavaFX - Stroke Line Cap Property
- JavaFX - Smooth Property
- Operations on 2D Objects
- JavaFX - 2D Shapes Operations
- JavaFX - Union Operation
- JavaFX - Intersection Operation
- JavaFX - Subtraction Operation
- JavaFX Path Objects
- JavaFX - Path Objects
- JavaFX - LineTo Path Object
- JavaFX - HLineTo Path Object
- JavaFX - VLineTo Path Object
- JavaFX - QuadCurveTo Path Object
- JavaFX - CubicCurveTo Path Object
- JavaFX - ArcTo Path Object
- JavaFX Color and Texture
- JavaFX - Colors
- JavaFX - Linear Gradient Pattern
- JavaFX - Radial Gradient Pattern
- JavaFX Text
- JavaFX - Text
- JavaFX Effects
- JavaFX - Effects
- JavaFX - Color Adjust Effect
- JavaFX - Color input Effect
- JavaFX - Image Input Effect
- JavaFX - Blend Effect
- JavaFX - Bloom Effect
- JavaFX - Glow Effect
- JavaFX - Box Blur Effect
- JavaFX - GaussianBlur Effect
- JavaFX - MotionBlur Effect
- JavaFX - Reflection Effect
- JavaFX - SepiaTone Effect
- JavaFX - Shadow Effect
- JavaFX - DropShadow Effect
- JavaFX - InnerShadow Effect
- JavaFX - Lighting Effect
- JavaFX - Light.Distant Effect
- JavaFX - Light.Spot Effect
- JavaFX - Point.Spot Effect
- JavaFX - DisplacementMap
- JavaFX - PerspectiveTransform
- JavaFX Transformations
- JavaFX - Transformations
- JavaFX - Rotation Transformation
- JavaFX - Scaling Transformation
- JavaFX - Translation Transformation
- JavaFX - Shearing Transformation
- JavaFX Animations
- JavaFX - Animations
- JavaFX - Rotate Transition
- JavaFX - Scale Transition
- JavaFX - Translate Transition
- JavaFX - Fade Transition
- JavaFX - Fill Transition
- JavaFX - Stroke Transition
- JavaFX - Sequential Transition
- JavaFX - Parallel Transition
- JavaFX - Pause Transition
- JavaFX - Path Transition
- JavaFX Images
- JavaFX - Images
- JavaFX 3D Shapes
- JavaFX - 3D Shapes
- JavaFX - Creating a Box
- JavaFX - Creating a Cylinder
- JavaFX - Creating a Sphere
- Properties of 3D Objects
- JavaFX - Cull Face Property
- JavaFX - Drawing Modes Property
- JavaFX - Material Property
- JavaFX Event Handling
- JavaFX - Event Handling
- JavaFX - Using Convenience Methods
- JavaFX - Event Filters
- JavaFX - Event Handlers
- JavaFX UI Controls
- JavaFX - UI Controls
- JavaFX - ListView
- JavaFX - Accordion
- JavaFX - ButtonBar
- JavaFX - ChoiceBox
- JavaFX - HTMLEditor
- JavaFX - MenuBar
- JavaFX - Pagination
- JavaFX - ProgressIndicator
- JavaFX - ScrollPane
- JavaFX - Separator
- JavaFX - Slider
- JavaFX - Spinner
- JavaFX - SplitPane
- JavaFX - TableView
- JavaFX - TabPane
- JavaFX - ToolBar
- JavaFX - TreeView
- JavaFX - Label
- JavaFX - CheckBox
- JavaFX - RadioButton
- JavaFX - TextField
- JavaFX - PasswordField
- JavaFX - FileChooser
- JavaFX - Hyperlink
- JavaFX - Tooltip
- JavaFX - Alert
- JavaFX - DatePicker
- JavaFX - TextArea
- JavaFX Charts
- JavaFX - Charts
- JavaFX - Creating Pie Chart
- JavaFX - Creating Line Chart
- JavaFX - Creating Area Chart
- JavaFX - Creating Bar Chart
- JavaFX - Creating Bubble Chart
- JavaFX - Creating Scatter Chart
- JavaFX - Creating Stacked Area Chart
- JavaFX - Creating Stacked Bar Chart
- JavaFX Layout Panes
- JavaFX - Layout Panes
- JavaFX - HBox Layout
- JavaFX - VBox Layout
- JavaFX - BorderPane Layout
- JavaFX - StackPane Layout
- JavaFX - TextFlow Layout
- JavaFX - AnchorPane Layout
- JavaFX - TilePane Layout
- JavaFX - GridPane Layout
- JavaFX - FlowPane Layout
- JavaFX CSS
- JavaFX - CSS
- Media with JavaFX
- JavaFX - Handling Media
- JavaFX - Playing Video
- JavaFX Useful Resources
- JavaFX - Quick Guide
- JavaFX - Useful Resources
- JavaFX - Discussion
JavaFX - Pie Chart
A pie-chart is a representation of values as slices of a circle with different colors. These slices are labeled and the values corresponding to each slice is represented in the chart.
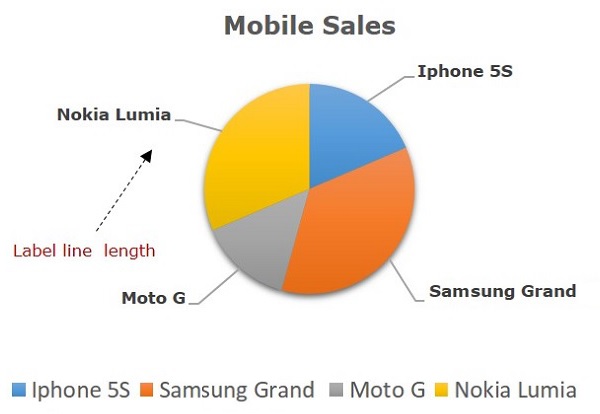
Following is a Pie Chart depicting the mobile sales of various companies at an instance.
Pie Chart in JavaFX
In JavaFX, a pie chart is represented by a class named PieChart. This class belongs to the package javafx.scene.chart.
By instantiating this class, you can create a PieChart node in JavaFX.
This class has 5 properties which are as follows −
clockwise − This is a Boolean Operator; on setting this operator true, the data slices in the pie charts will be arranged clockwise starting from the start angle of the pie chart.
data − This represents an ObservableList object, which holds the data of the pie chart.
labelLineLength − An integer operator representing the length of the lines connecting the labels and the slices of the pie chart.
labelsVisible − This is a Boolean Operator; on setting this operator true, the labels for the pie charts will be drawn. By default, this operator is set to be true.
startAngle − This is a double type operator, which represents the angle to start the first pie slice at.
To generate a pie chart, Prepare an ObservableList object. After preparing the ObservableList object, pass it as an argument to the constructor of the class PieChart; Or, by using the method named setData().
Steps to Generate Pie Chart
To generate a PieChart in JavaFX, follow the steps given below.
Step 1: Creating a Class
Create a Java class and inherit the Application class of the package javafx.application and implement the start() method of this class as follows.
public class ClassName extends Application {
   @Override
   public void start(Stage primaryStage) throws Exception {
   }
}
Step 2: Preparing the ObservableList Object
Prepare an object of the interface ObservableList object by passing the data of the pie chart as shown below −
ObservableList<PieChart.Data> pieChartData = FXCollections.observableArrayList(
   new PieChart.Data("Iphone 5S", 13),
   new PieChart.Data("Samsung Grand", 25),
   new PieChart.Data("MOTO G", 10),
   new PieChart.Data("Nokia Lumia", 22));
Step 3: Creating a PieChart Object
Create a PieChart by passing the ObservableList object as shown below.
//Creating a Pie chart
PieChart pieChart = new PieChart(pieChartData);
Step 4: Setting the Title of the Pie Chart
Set the title of the Pie Chart using the setTitle() method of the class PieChart. This belongs to the package javafx.scene.chart −
//Setting the title of the Pie chart
pieChart.setTitle("Mobile Sales");
Step 5: Setting the Slices Clockwise
Set the slices of the Pie Charts clockwise. This is done by passing Boolean value true to the setClockwise() method of the class PieChart. This belongs to the package javafx.scene.chart −
//setting the direction to arrange the data
pieChart.setClockwise(true);
Step 6: Set the Length of the Label Line
Set the length of the label line using the setLabelLineLength() method of the class PieChart which belongs to the package javafx.scene.chart, as follows −
//Setting the length of the label line
pieChart.setLabelLineLength(50);
Step 7: Set the Labels Visible
Set the labels of the pie chart to visible by passing the Boolean value true to the method setLabelsVisible() of the class PieChart. This belongs to the package javafx.scene.chart −
//Setting the labels of the pie chart visible
pieChart.setLabelsVisible(true);
Step 8: Set the Start Angle of the Pie Chart
Set the Start angle of the pie chart using the setStartAngle() method of the class PieChart. This belongs to the package javafx.scene.chart −
//Setting the start angle of the pie chart
pieChart.setStartAngle(180);
Step 9: Creating a Group Object
In the start() method, create a group object by instantiating the class named Group. This belongs to the package javafx.scene. Pass the PieChart (node) object, created in the previous step as a parameter to the constructor of the Group class. This should be done in order to add it to the group as follows −
Group root = new Group(piechart);
Step 10: Launching Application
Lastly, follow the given steps below to launch the application properly −
Firstly, instantiate the class named Scene by passing the Group object as a parameter value to its constructor. To this constructor, you can also pass dimensions of the application screen as optional parameters.
Then, set the title to the stage using the setTitle() method of the Stage class.
Now, a Scene object is added to the stage using the setScene() method of the class named Stage.
Display the contents of the scene using the method named show().
Lastly, the application is launched with the help of the launch() method.
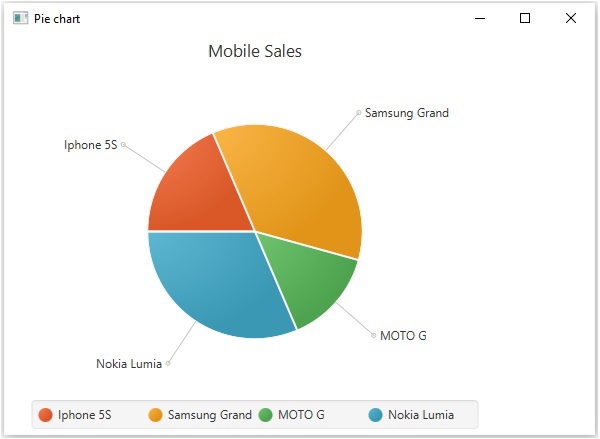
Example
The table given below depicts mobile sale with the help of a pie chart. The following table has a list of different mobile brands and their sale (units per day).
| S.No | Mobile Brands | Sales (Units per day) |
|---|---|---|
| 1 | Iphone 5S | 20 |
| 2 | Samsung Grand | 20 |
| 3 | MOTO G | 40 |
| 4 | Nokia Lumia | 10 |
Following is a Java program which generates a pie chart, depicting the above data using JavaFX. Save this code in a file with the name PieChartExample.java.
import javafx.application.Application;
import javafx.collections.FXCollections;
import javafx.collections.ObservableList;
import javafx.scene.Group;
import javafx.scene.Scene;
import javafx.stage.Stage;
import javafx.scene.chart.PieChart;

public class PieChartExample extends Application {
   @Override
   public void start(Stage stage) {
      //Preparing ObservbleList object
      ObservableList<PieChart.Data> pieChartData = FXCollections.observableArrayList(
         new PieChart.Data("Iphone 5S", 13),
         new PieChart.Data("Samsung Grand", 25),
         new PieChart.Data("MOTO G", 10),
         new PieChart.Data("Nokia Lumia", 22));

      //Creating a Pie chart
      PieChart pieChart = new PieChart(pieChartData);

      //Setting the title of the Pie chart
      pieChart.setTitle("Mobile Sales");

      //setting the direction to arrange the data
      pieChart.setClockwise(true);

      //Setting the length of the label line
      pieChart.setLabelLineLength(50);

      //Setting the labels of the pie chart visible
      pieChart.setLabelsVisible(true);

      //Setting the start angle of the pie chart
      pieChart.setStartAngle(180);

      //Creating a Group object
      Group root = new Group(pieChart);

      //Creating a scene object
      Scene scene = new Scene(root, 600, 400);

      //Setting title to the Stage
      stage.setTitle("Pie chart");

      //Adding scene to the stage
      stage.setScene(scene);

      //Displaying the contents of the stage
      stage.show();
   }
   public static void main(String args[]){
      launch(args);
   }
}
Compile and execute the saved java file from the command prompt using the following commands.
javac --module-path %PATH_TO_FX% --add-modules javafx.controls PieChartExample.java
java --module-path %PATH_TO_FX% --add-modules javafx.controls PieChartExample
Output
On executing, the above program generates a JavaFX window displaying a pie chart as shown below.
Example
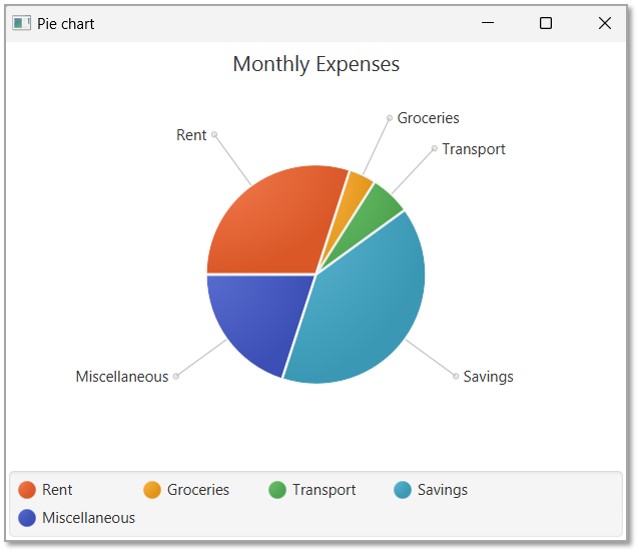
Let us see another example to draw a JavaFX pie chart illustrating monthly expenses of a private employee whose salary is 25,000 INR per month. Save the file under the name PieChartEmployee.java.
| S.No | Necessities | Expenses |
|---|---|---|
| 1 | Rent | 7500 |
| 2 | Groceries | 1000 |
| 3 | Transport | 1500 |
| 4 | Savings | 10000 |
| 5 | Miscellaneous | 5000 |
 import javafx.application.Application;
import javafx.collections.FXCollections;
import javafx.collections.ObservableList;
import javafx.scene.Group;
import javafx.scene.Scene;
import javafx.stage.Stage;
import javafx.scene.chart.PieChart;

public class PieChartEmployee extends Application {
   @Override
   public void start(Stage stage) {
      //Preparing ObservbleList object
      ObservableList pieChartData = FXCollections.observableArrayList(
         new PieChart.Data("Rent", 7500),
         new PieChart.Data("Groceries", 1000),
         new PieChart.Data("Transport", 1500),
         new PieChart.Data("Savings", 10000),
		 new PieChart.Data("Miscellaneous", 5000));

      //Creating a Pie chart
      PieChart pieChart = new PieChart(pieChartData);

      //Setting the title of the Pie chart
      pieChart.setTitle("Monthly Expenses");

      //setting the direction to arrange the data
      pieChart.setClockwise(true);

      //Setting the length of the label line
      pieChart.setLabelLineLength(50);

      //Setting the labels of the pie chart visible
      pieChart.setLabelsVisible(true);

      //Setting the start angle of the pie chart
      pieChart.setStartAngle(180);

      //Creating a Group object
      Group root = new Group(pieChart);

      //Creating a scene object
      Scene scene = new Scene(root, 600, 400);

      //Setting title to the Stage
      stage.setTitle("Pie chart");

      //Adding scene to the stage
      stage.setScene(scene);

      //Displaying the contents of the stage
      stage.show();
   }
   public static void main(String args[]){
      launch(args);
   }
}
Compile and execute the saved java file from the command prompt using the following commands.
javac --module-path %PATH_TO_FX% --add-modules javafx.controls PieChartEmployee.java
java --module-path %PATH_TO_FX% --add-modules javafx.controls PieChartEmployee
Output
On executing, the above program generates a JavaFX window displaying a pie chart as shown below.