Software Testing - Cause-Effect Graph
A developed software goes through various testing stages to validate whether it is satisfying all the requirements and conditions. In the black box approach, the generated output from input data sets are verified. The cause effect graph is one of the techniques which comes under the black box testing. It is an approach where a graph is used to depict the states for multiple combinations of inputs.
What is a Cause Effect Graph?
A cause effect graph is a methodology which helps to generate a high yield group of test cases. This methodology has come up to eradicate the loopholes of equivalence partitioning, and boundary value analysis where testing of all the combinations of input conditions are not feasible.
So whenever we need to verify some critical scenarios consisting of combinations of input criterias, then the cause effect graph is used. The graph obtained is converted into a decision table which in turn can be used to design the test cases. The major benefit of the cause effect graph method is that it helps to detect wherever there exists incomplete or unclear requirements.
Create Test Cases from a Cause Effect Graph
The steps to create test cases from a cause effect graph are listed below −
Step 1 − Detect the causes and effects from the requirements and then assign distinct numbers to them. A cause is a unique input condition because of which the system undergoes some kind of changes. An effect is an output condition or state of change in the system that is caused by an input condition.
Step 2 − Create a boolean graph which connects all the causes and effects. This is known as the cause effect graph which depicts for what all causes different effects have been generated.
Step 3 − Point out the constraints on the cause effect graph, describing all the combinations of causes and/or effects which are practically not possible. All possible constraints are listed below −
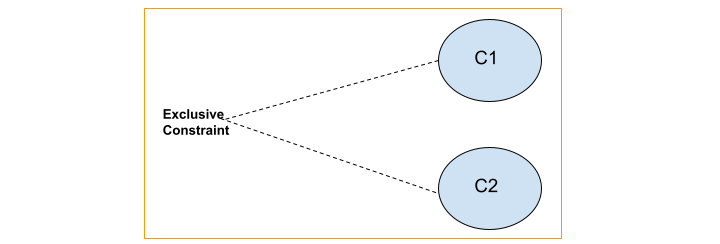
Exclusive Constraints
These constraints are between two causes C1, and C2, such that either C1 or C2 can have the value as 1, both simultaneously can not hold the value 1.
Inclusive Constraints
These constraints are between the causes C1, C2, and C3, such that at least one of them is always equal to 1, and hence all of them simultaneously can not hold the value 1.

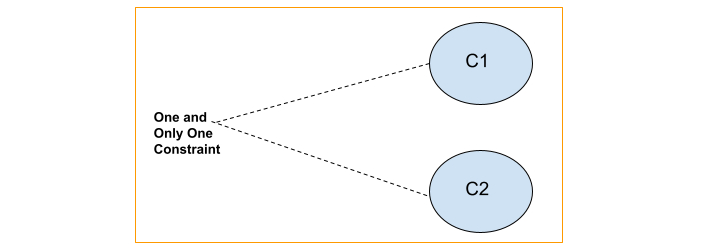
One and Only One Constraint
These constraints are between the causes C1, and C2, such that one and only one of C1 and C2 should be 1.
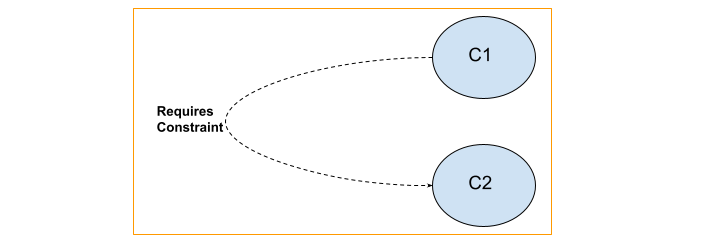
Requires Constraint
These constraints are between the causes C1, and C2, such that if C1 is equal to 1, then C2 should also be 1. It is not possible for C1 to have the value 1 with the C2 having the value as 0.
Mask Constraint
These constraints are between the effects E1, and E2, such that if E1 is equal to 1, then E2 should be 0.

Convert the cause effect graph into a limited entry decision table by linking the state conditions in the cause effect graph. In the decision table, each column is converted into a test case.
Notations Used in the Cause Effect Graph
The notations used in cause effect graph are listed below −
Identify Function
It says that if the condition C1 and event E1 is related to each other by an Identify Function, it means that if C1 holds true or equal to 1 then E1 is also equal to 1, else E1 is equal to 0.

Not Function
It says that if the condition C1 and event E1 is related to each other by a Not Function, it means that if C1 holds true or equal to 1 then E1 is equal to 0, else E1 is equal to 1.

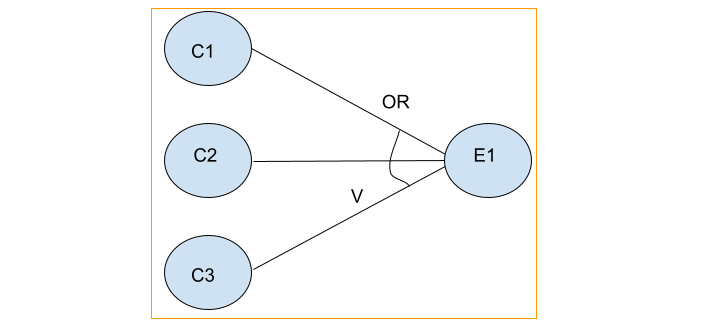
OR Function
It is denoted by the symbol V. It can be used to relate the n number of conditions to a single effect. It says that if the conditions C1, or C2, or C3 hold true or equal to 1, then the event E1 is equal to 1, else E1 is equal to 0.
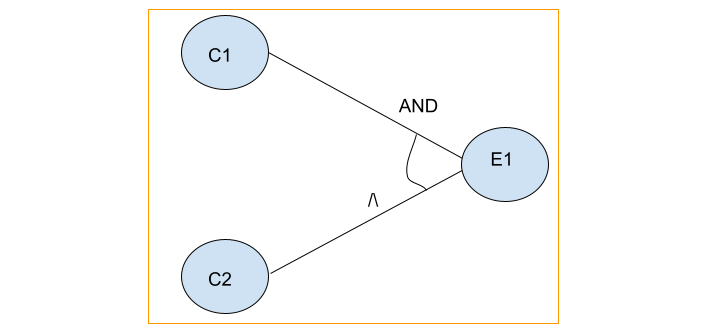
AND Function
It is denoted by the symbol /\. It can be used to relate the n number of conditions to a single effect. It says that if both the conditions C1, and C2 hold true or equal to 1, then the event E1 is equal to 1, else E1 is equal to 0.
Example
Let us take an example of a problem statement which says the first column should have the value X or Y. The second column should hold only digits. If both these conditions are satisfied, then a file should be modified. If the first column does not hold the values either X or Y, then the message M1 is generated. If the second column is fed with no digits, then the message M2 is generated.
To solve this problem using a control flow graph, we would first summarize the different conditions, and the events.
- Condition 1 denoted by C1 refers to column 1 holding value X.
- Condition 2 denoted by C2 refers to column 1 holding value Y.
- Condition 3 denoted by C3 refers to column 2 holding a digit.
- Effect 1 denoted by E1 refers to modification of a file. The effect E1 should come true for the condition → (C1 V C2) /\ C3.
- Effect 2 denoted by E2 refers to the message M1.
- Effect 3 denoted by E3 refers to the message M2.
The cause effect graph of the above problem statement is given below −

Conclusion
This concludes our comprehensive take on the tutorial on Software Cause Effect Graph. Weve started with describing what is a cause effect graph, how to create test cases from a cause effect graph, What are the notations used in cause effect graph, and an example on cause effect graph. This equips you with in-depth knowledge of Software Cause Effect Graph. It is wise to keep practicing what youve learned and exploring others relevant to Software Testing to deepen your understanding and expand your horizons.
