- HTML Canvas - Home
- HTML Canvas - Introduction
- Environmental Setup
- HTML Canvas - First Application
- HTML Canvas - Drawing 2D Shapes
- HTML Canvas - Path Elements
- 2D Shapes Using Path Elements
- HTML Canvas - Colors
- HTML Canvas - Adding Styles
- HTML Canvas - Adding Text
- HTML Canvas - Adding Images
- HTML Canvas - Canvas Clock
- HTML Canvas - Transformations
- Composting and Clipping
- HTML Canvas - Basic Animations
- Advanced Animations
- HTML Canvas API Functions
- HTML Canvas - Element
- HTML Canvas - Rectangles
- HTML Canvas - Lines
- HTML Canvas - Paths
- HTML Canvas - Text
- HTML Canvas - Colors and Styles
- HTML Canvas - Images
- HTML Canvas - Shadows and Transformations
- HTML Canvas Useful Resources
- HTML Canvas - Quick Guide
- HTML Canvas - Useful Resources
- HTML Canvas - Discussion
HTML Canvas - Quick Guide
HTML Canvas - Introduction
Canvas is an HTML element that can perform dynamic generation of 2D shapes and bitmap images using JavaScript. HTML Canvas is a great alternative for drawing pictorial data such as graphs, charts, and maps inside a web page. It is a low-level procedural model which updates in the form of a bitmap.
The Canvas element is only the basic rectangular-shaped container for graphics, which is usually done using JavaScript. The shapes or any other graphics implementation inside the Canvas element can be done using JavaScript. HTML Canvas element is an HTML tag like the div, a, or table, with the exception that its contents are rendered using JavaScript.
Why Canvas?
There are more than 1.2 billion websites available today which are unique from each other and have various features involved. The canvas element is specially designed to make visual content that can be uniquely applied to develop website UI and make them more attractive for users. It is very easy to learn and requires a knowledge base of HTML and JavaScript.
Canvas and <img> tag?
The canvas element looks like the HTML5 image <img> element at first, except for not having "src" and "alt" attributes. Unlike the image element, the canvas element requires the closing tag. The canvas element does have only two attributes which are width and height. To design graphics using Canvas, we must use JavaScript.
Dimensions of Canvas
By default, canvas does not have a border and no content. The width and height can be declared in the element or can be manually adjusted using the DOM properties of JavaScript. When no width and height attributes are given in the code, it is set to default where width is 300 pixels and height is 150 pixels.
The element can also be styled by CSS, using the Style tag, and can also give parameters such as border color and thickness. If the CSS Style or dimensions are given do not match with the initial Canvas, it will appear as a distorted rectangle. Even though, the Canvas element can be styled using CSS, the actual drawing on the Canvas remains ineffective and can be modified using Scripting languages
Canvas element and Canvas context
While using canvas, it is important to understand the basic difference between the canvas element and the canvas context, as often people get these both confused. The canvas element is the actual DOM node that is embedded in the HTML page. A canvas context is an object with properties and methods that you can use to render graphics inside the canvas element. The context can be 2D or 3D (by using WebGL). We can assign only one context to the canvas element using the getContext() function. Changing context multiple times in the same canvas may result in the same object context.
Structure of Canvas element
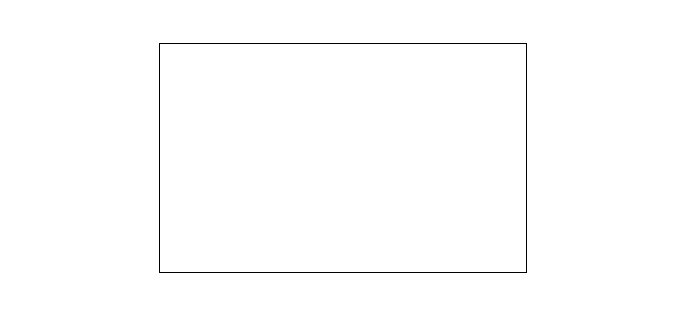
A simple <canvas> element is defined using the attributes id, width, height, and style to observe the canvas border. The main thing to be identified here is that without giving any style to the canvas, it cannot be observed on the webpage even though it is formed. A simple canvas tag is shown below.
<canvas id="canvas" width="555" height="555" style="border:2px solid black;">
   This browser neither have JavaScript enabled nor support HTML5 canvas tag.
</canvas>
The canvas element is identified using id or class to render graphics in the future using JavaScript. In the above example, a canvas is built with dimensions 555×555 with the border colored black. The sentence inserted between the canvas tag is displayed when there is an error that causes the canvas to not display. The text displayed on the page makes the user identify that there is an error in displaying the canvas. The canvas outline is shown below.
HTML5 Canvas vs Scalable Vector Graphics (SVG)
Scalable Vector Graphics (SVG) is an XML-based markup language developed by World Wide Web Consortium (W3C) in 1999 for visualizing 2D-based vector graphics. It is an earlier standard for drawing shapes and designing graphics in browsers.
SVG is a text-based, open Web standard for describing images that can be rendered cleanly at any size and are designed specifically to work well with other web standards including CSS, DOM, JavaScript, and SMIL.
SVG-format vector images can be easily localized by updating the text within them, without the need of any graphical editor to do so. The HTML Canvas element works like the SVG with some differences mentioned below.
| HTML Canvas | Scalable Vector Graphics (SVG) |
|---|---|
| Canvas represents 2D images using a rectangular grid of pixels. | SVG represents 2D images using geometric shapes designed from cartesian planes such as points, lines, and curves. |
| Canvas objects are drawn in the immediate mode where if any error occurs the canvas becomes irregular. | SVG objects are remembered by DOM and are rendered to bitmap to use in case of change in attributes. |
| Canvas has poor scalability as it is a low-level procedural model. | SVG has high scalability, we can print high-quality graphics at any resolution. |
| Canvas can be modified using script only. | SVG can be modified using CSS and script. |
| Canvas only has a single graphic element. | SVG has multiple elements which are a part of the page's DOM tree. |
| Canvas element tag is defined by <canvas>. | SVG element is defined by <svg> tag. |
The canvas element has two sizes. The first one is the size of the element itself which can be altered by changing the element's width and height attributes.
Another size is the element's drawing surface. CSS attributes can only change an element's size, but the drawing surface remains unaffected.
The Canvas element can be designed in two parts
Initializing HTML5 Canvas element.
Designing graphics on the drawing surface.
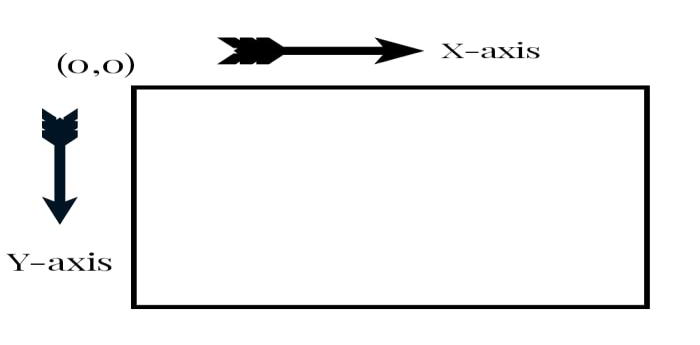
Canvas Coordinates
We must understand the canvas coordinates before drawing a Canvas element. A canvas consists of a drawable region initiated in HTML code having height and width as attributes. The Canvas element is a two-dimensional rectangular area. The top-left corner of the canvas element is considered as the origin (0,0) where the attributes are width and height. The bottom-right corner of the canvas element is (canvas width, canvas height) which is given by the user. The dimensions of the Canvas element are given by the user using CSS attributes. If not given width and height are set by default as (300,150).
Simple Example of Canvas element
Here is the basic code snippet to draw a canvas element. The width and height are 555px and 555px.
<!DOCTYPE html>
<html lang="en">
<head>
   <title>Canvas Element</title>
</head>
<body>
   <canvas id="canvas" width="555" height="555" style="border:2px solid orange;">
   </canvas>
</body>
</html>
The output for the above code snippet is
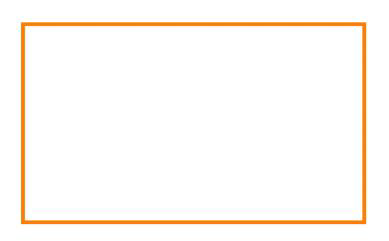
The above snippet helps us to understand how the canvas is implemented using the attributes provided.
Applications of the Canvas element
Canvas is equipped with many graphic features which have a wide array of applications over the web. Some of the main applications of Canvas are
HTML5 Canvas can be used to draw text on web pages.
The canvas element is used to develop productive graphics.
We can design simple animations such as sparkling stars to complex animations using canvas elements.
Canvas elements can be used for website interactivity as they can respond to JavaScript events and respond to user actions.
Canvas is commonly used to build 2D games on websites.
History
The idea to invent a graphic interface for mobile applications and webpages was firstly coined in the early 2000s and many organizations have started research to address this issue. The history of the Canvas element is given below.
Canvas is an HTML5 element initially introduced by Apple for the development of their products in 2004.
Apple had mainly used canvas for Web kit components to improve the UI graphics and dashboard widgets on the Safari browsers.
It was later standardized by the Web Hypertext Application Technology Working Group (WHATWG) who were behind the development of HTML and next-generation web technologies available today.
Previously, the Canvas element was used to make online 2D games as it was more effective, and the available graphic features were more attractive for the users.
Canvas is an HTML element that can perform dynamic generation of 2D shapes and bitmap images using JavaScript. Previously, due to websites encouraging ads, JavaScript had caused so many issues to the users which caused rendering issues. Later it is resolved by disabling JavaScript in browsers which led to the disability of Canvas. If a user wants to work on Canvas, JavaScript must be enabled manually.
The available browsers today are JavaScript enabled HTML Canvas is a great alternative for drawing pictorial data such as graphs, charts, and maps inside a web page which makes it easier to use the Canvas element.
HTML Canvas is a great alternative for drawing pictorial data such as graphs, charts, and maps inside a web page. It has been widely used today.
HTML Canvas - Environmental Setup
One of the best applications of the canvas is that it works on any browser which is equipped with HTML5 and JavaScript support. This makes it so versatile and easy to work on. All the browsers available today such as Chrome, Opera, Mozilla, Edge, and Safari are equipped with JavaScript support. Hence any editor that can be used to display HTML and JavaScript code can be used to work with the HTML5 Canvas element. Furthermore, your browser must be permitted to access and execute JavaScript code. Below is the table which contains browser names and version numbers from which HTML5 canvas can be supported.
| Browser Name | Canvas Support |
|---|---|
| Google Chrome | 4.0 and above |
| Microsoft Edge | 9.0 and above |
| Mozilla Firefox | 2.0 and above |
| Opera | 3.1 and above |
| Apple Safari | 9.0 and above |
The basic requirements needed for implementing 2D dynamic graphical designs and visualization effects using the Canvas element are listed below
A text editor
To write code in. This could be any text editor such as Visual Studio Code (VS code), Notepad++, Sublime Text, or Atom. We cannot use document editors to create the Canvas element as we cannot use JavaScript only in hybrid editors. I recommend Sublime Text or Visual Studio Code as they are very easy to script. Visual Studio Code comes with an in-built local server to run the web programs on the local server with a random port. Sublime text is equipped with easy tools which make it simpler to use and work on. There are also several online compilers such as codepen.io which make it easier to work on without downloading any IDE.
Web browsers
To test code in webpages and understand it's structure. Currently, the most-used browsers are Mozilla Firefox, Google Chrome, Microsoft Edge, Opera Browser and Apple Safari. You should also test how your site performs on mobile devices and on any old browsers your target audience may still be using (such as IE 8-10). This helps to improve and understand how the Canvas element is interacted with the web page. There are also some different web browsers such as Lynx, which is a text-based terminal web browser used for seeing how your site is experienced by visually impaired users. You can also use Explorer-canvas to get canvas support through Internet Explorer. To make it work, we must include below JavaScript snippet in our code
<!--[if IE]><script src = "canvas.js"></script><![endif]-->
Verification
Execute the following example to check if editor is working correctly or not
<!DOCTYPE html>
<html lang="en">
<head>
   <title>Check editor</title>
</head>
<body>
   <p>Hello viewers</p>
   <canvas id="canvas" width="300" height="150" style="border: 2px solid black;">
      This text is displayed if your browser does not support HTML5 Canvas or if JavaScript is disabled.
   </canvas>
</body>
</html>
If the editor creates a web page containing the string "Hello viewers" and a small hollow rectangle, the editor is installed correctly. If the webpage does not render anything installation is not done correctly. The text available inside the Canvas tag is displayed only when the web browser does not support the Canvas element. You need to update your browser or install one which supports the Canvas element.
HTML Canvas - First Application
In the previous chapters we have already seen how to create a Canvas element using the <canvas> tag. Now we will style the Canvas element using simple CSS styles which helps us to understand how the Canvas element is formed.
Let us first create an empty Canvas element and style using the following attributes
Add background-color
Change border
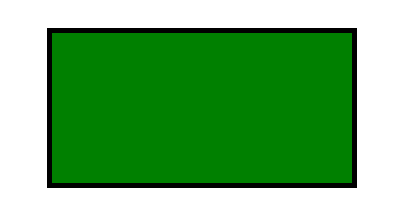
Adding background color to the Canvas element
Following code demonstrates how to add color to the Canvas element using CSS style attributes. We are using background_color attribute of the Canvas element. The code is given below.
<!DOCTYPE html>
<html lang="en">
<head>
   <title>Canvas Element</title>
   <style>
      #canvas{
         border:5px solid black;
         background-color: green;
      }
   </style>
</head>
<body>
   <canvas id="canvas" width="300" height="150" >
      This text is displayed if your browser does not support HTML5 Canvas or if JavaScript is disabled.
   </canvas>
</body>
</html>
Output
Changing border of the Canvas element
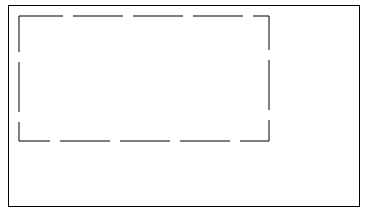
By using CSS style attributes, we can change the border style of Canvas element easily. It is useful when creating an interactive visual graphics using Canvas. Following is the implementation of changing the border style of the Canvas element.
<!DOCTYPE html>
<html lang="en">
<head>
   <title>Canvas Element</title>
   <style>
      #canvas{
         border:2px dotted black;
      }
   </style>
</head>
<body>
   <canvas id="canvas" width="300" height="150" >
      This text is displayed if your browser does not support HTML5 Canvas or if JavaScript is disabled.
   </canvas>
</body>
</html>
Output
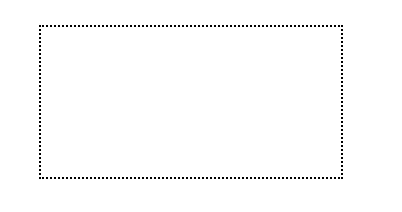
Instead of using solid while creating the Canvas element, we can use one of the following to change the style of the Canvas border per our requirement
Dotted
Dashed
Double
Groove
Ridge
HTML Canvas - Drawing 2D Shapes
Till now we have seen how to draw the Canvas element using attributes. Now we will be building simple 2D shapes and rendering them inside the Canvas element. The Canvas element supports only two primitive shapes, rectangles, and paths by which all the remaining shapes can be drawn easily. There are many drawing functions available which makes it easier to construct all the remaining shapes from paths.
HTML5 Canvas can be used to draw 2D shapes which are used further to develop graphical objects. It is possible to draw all kinds of shapes using Canvas elements including complex shapes such as polygons and curves. Each of the shapes that can be drawn using Canvas is drawn using basic design features such as fill and stroke. These features help us to add graphics to the hollow 2D shapes and make beautiful visualizations. Before drawing shapes on Canvas, we must understand the grid concept to efficiently construct graphical shapes. The Canvas element can be accessed to draw various shapes using the following steps
Find the Canvas element.
Create a Drawing object using JavaScript to draw inside the canvas element.
Draw on the canvas using script objects.
Almost all 2D shapes can be drawn using the Canvas element which is further styled by some common functions and Event listeners such as gradient, colors, etc. These help in increasing user interactivity and visual content understanding.
The shapes that can be drawn using the Canvas element are
Rectangles
Squares (using rectangle functions)
Circles
ellipse
Triangles
Curves
Lines
Arcs
Canvas co-ordinate space (Grid)
To draw any shape using the Canvas element, we must understand the concept of a Grid. The grid shows the structural representation of the Canvas element and helps us to understand how a shape is inserted into the canvas. The whole Canvas element is divided into squares with a side of 1 pixel. The coordinates of the outer Canvas element are considered to draw the elements in the canvas at different positions. The shapes are generally inserted into the Canvas such that their coordinates lie between origin and the canvas width and height. Below is the image of the grid and how a square is inserted into the Canvas element.
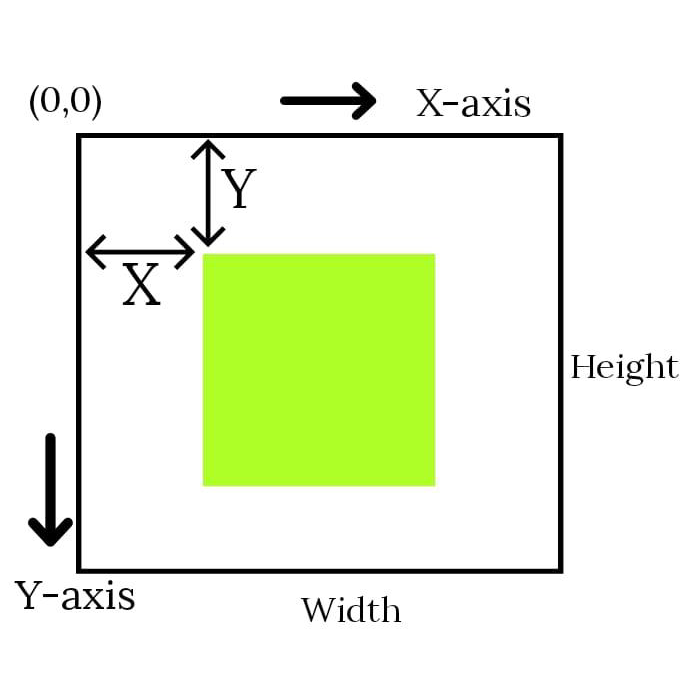
Normally, one unit inside the Canvas is considered as 1 pixel. The origin of this grid is positioned in the top left corner with coordinates (0,0). All elements are placed using this origin and the bottom-left coordinates (canvas width, canvas height). So, the position of the top left corner of the green square inside the Canvas element becomes x pixels from the left and y pixels from the top, at coordinate (x, y).
Drawing rectangles using HTML5 Canvas
Rectangles can be drawn in two ways. The first one is by using four lines (two parallel lines each representing width and height of the rectangle) which makes it complex and not generic. The other approach to drawing rectangles is by using the available functions. Three functions can be used to draw rectangles using Canvas by considering the coordinates of the shape. We can draw rectangles using three functions namely
| S.No | Method & Description |
|---|---|
| 1 | fillRect(x, y, width, height) This function creates a filled rectangle. |
| 2 | strokeRect(x, y, width, height) This function creates a stroked/hollow rectangle. |
| 3 | clearRect(x, y, width, height) This function creates a clear rectangle. |
17 Each of these functions is used to create/draw a different type of rectangle. The parameters involved in the functions are
(X, Y) − Distance from the origin. The main point from which the rectangle is drawn.
Width − The width of the rectangle to be drawn.
Height − The height of the rectangle to be drawn.
Each of the rectangle functions is implemented below with functioning code.
Creating a Fill Rectangle
By using the above function, we can draw a filled rectangle. It takes the starting co-ordinates (x, y) and the width and height of rectangle as parameters. Simple syntax for the function is
Canvas.fillRect(50, 50, 300, 150);
Example
The code to implement fillRect() is given below.
<!DOCTYPE html>
<html lang="en">
   <head>
      <title>fillRect()</title>
      <style>
         body {
            margin: 10px;
            padding: 10px;
         }
      </style>
      <script>
         function rectangle() {
            var canvas = document.getElementById('canvas');
            if (canvas.getContext) {
               var ctx = canvas.getContext('2d');
               ctx.fillRect(50, 50, 200, 200);
            }
         }
      </script>
   </head>
   <body onload="rectangle();">
      <canvas id="canvas" width="555" height="555" style="border: 1px solid black;"></canvas>
   </body>
</html>
Output
The output for the following code is
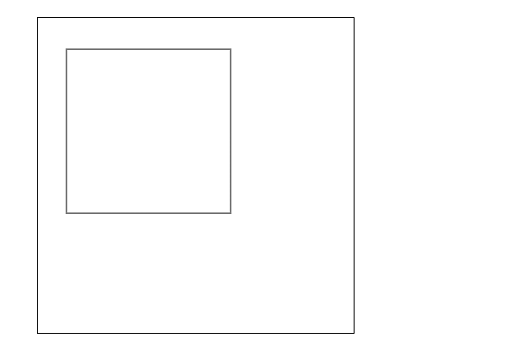
Creating a Stroke Rectangle
A rectangular outline can be drawn using strokeRect() function. It takes the starting co-ordinates (x, y) and the width and height of rectangle as parameters. Simple syntax for the function is
Canvas.strokeRect(50, 50, 300, 300);
Example
Following example creates a stroked rectangle
<!DOCTYPE html>
<html lang="en">
   <head>
      <title>strokeRect()</title>
      <style>
         body {
            margin: 10px;
            padding: 10px;
         }
      </style>
   </head>
   <body onload="rectangle();">
      <canvas id="canvas" width="555" height="555" style="border: 1px solid black;"></canvas>
      <script>
         function rectangle() {
            var canvas = document.getElementById('canvas');
            var context = canvas.getContext('2d');
            var x = 50;
            var y = 50;
            var width = 200;
            var height = 200;
            context.strokeRect(x, y, width, height);
         }
      </script>
   </body>
</html>
Output
The output for the above code is
Creating a Clear Rectangle
It takes the starting coordinates (x,y) and the width and height of the rectangle as parameters. The simple syntax for the function is
Canvas.clearRect(50, 50, 60, 60);
The following function clears the specified rectangular area by making it completely transparent. To understand the function, we will be using both the functions fillRect() and strokeRect(). Following example shows how the function clearRect() is worked.
Example
<!DOCTYPE html>
<html lang="en">
   <head>
      <title>clearRect()</title>
      <style>
         body {
            margin: 10px;
            padding: 10px;
         }
      </style>
      <script>
         function rectangle() {
            var canvas = document.getElementById('canvas');
            if (canvas.getContext) {
               var ctx = canvas.getContext('2d');
               ctx.fillRect(50, 50, 200, 200);
               ctx.clearRect(45, 45, 60, 60);
               ctx.strokeRect(50, 50, 50, 50);
            }
         }
      </script>
   </head>
   <body onload="rectangle();">
      <canvas id="canvas" width="555" height="555" style="border: 1px solid black;"></canvas>
   </body>
</html>
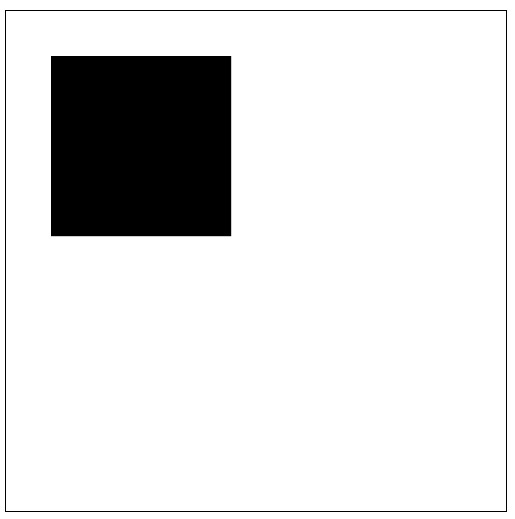
Output
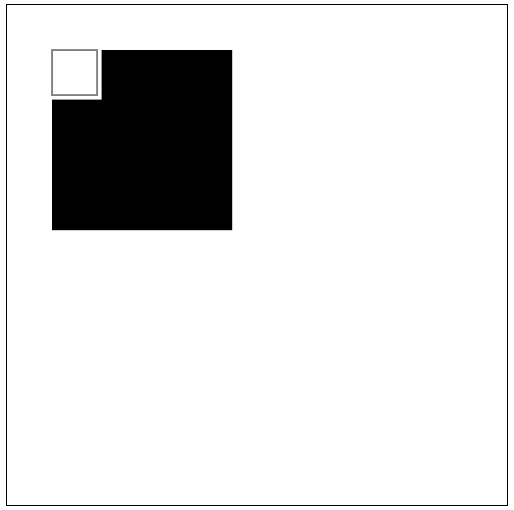
The output is shown below, the fillRect() fills the whole rectangle with black color in the given dimensions. The strokeRect() function marks the margin with the given dimensions and the clearRect() makes the rectangle area transparent by removing the black color.
HTML Canvas - Path Elements
The path is nothing but forming/drawing a basic shape constructed between two points, it can be defined as a list of points, connected by segments of lines, arcs, curves, etc. that can be used to make different shapes.
You can draw a path using the methods provided by the paths2D interface of HTML5 canvas.
Path elements
Path elements are various basic elements like curves, lines, and arcs used to form a path. Following are the methods provided by HTML5 Canvas API to draw various path elements
| S.No | Method & Description |
|---|---|
| 1 | moveTo() We use a virtual pointer while drawing with the path. It is always located at a specified point which can be accessed using the moveTo(x, y) method. |
| 2 | ineTo() This method draws a line from the virtual pointer to the point given as parameters in the lineTo() method. Before drawing a line, we must use the moveTo() function to send the cursor to the starting point from which the line should be drawn. |
| 3 | arcTo() This method will draw an arc using the path. It takes two points and a radius as parameters. The arc is drawn from start point to end point with the curvature using radius. |
| 4 | quadraticCurveTo() This function will draw a curve using one control point which is taken in reference to drawing the curve between the two points. |
| 5 | bezierCurveTo() This function will draw a curve between two points using two control points which determines the structure of the curve. |
Beginning and closing a Path
Since there are many functions involved to draw a Path, we use the methods to start and close the path using beginPath() and closePath() respectively. A simple code snippet is shown below on how to use path in the JavaScript code.
var canvas = document.getElementById('canvas');
var context = canvas.getContext('2d');
context.beginPath();
// ..... path operations
context.closePath();
In the above code, the operations which are written in between beginPath() and closePath() functions build the required path. The operations given after closing the path do not affect the path object and do not get executed normally.
The moveTo path element
One of the most important functions which do not provide any drawing from Canvas but is used to draw any shape from that point is by using the moveTo() function. This method moves the virtual pointer to the coordinates given as their parameters. The method is defined as
moveTo(x, y)
After initializing the Canvas element by calling beginPath(), we must call the
moveTo()
function so that the virtual pointer is moved to the given coordinates. At that point, drawing is started and the required shape is constructed.We have to ensure that the moveTo() parameters given are inside the Canvas element. If it is outside the Canvas, the drawing will not be shown and is hidden outside the canvas.
Example
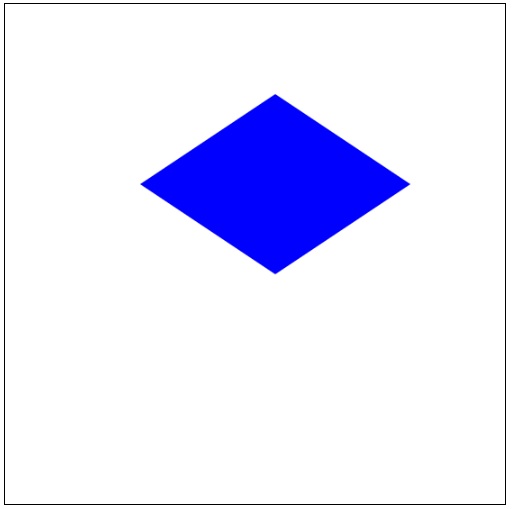
Following code draws the shape rhombus onto the Canvas element using Path 2D element methods moveTo() and lineTo()
<!DOCTYPE html>
<html lang="en">
   <head>
      <title>Rhombus</title>
   </head>
   <body onload="myFun();">
      <canvas id="canvas" width="555" height="555" style="border: 1px solid black;"></canvas>
      <script>
         function myFun() {
            var canvas = document.getElementById('canvas');
            if (canvas.getContext) {
               var ctx = canvas.getContext('2d');
               ctx.beginPath();
               ctx.moveTo(300, 100);
               ctx.lineTo(150, 200);
               ctx.lineTo(300, 300);
               ctx.lineTo(450, 200);
               ctx.lineTo(300, 100);
               ctx.fillStyle = "blue";
               ctx.fill()
            }
         }
      </script>
   </body>
</html>
Output
The rhombus generated by the above code is
The lineTo path element
The lineTo() method defines the coordinates of the end point of the line, and the stroke() or fill() method is used to make the line visible on the canvas element. Let us look at an example to see how the method works.
Example
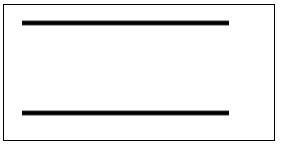
The following example demonstrates the lineTo() method. The implementation code is given below.
<!DOCTYPE html>
<html lang="en">
   <head>
      <title>lineTo()</title>
      <style>
         body {
            margin: 10px;
            padding: 10px;
         }
      </style>
   </head>
   <body onload="line()">
      <canvas id="canvas" width="300" height="150" style="border: 1px solid black;"></canvas>
      <script>
         function line() {
            var canvas = document.getElementById('canvas');
            var context = canvas.getContext('2d');
            context.lineWidth = 5.0;
            context.beginPath();
            context.strokeStyle = 'black';
            context.moveTo(20, 20);
            context.lineTo(250, 20);
            context.stroke();
            context.beginPath();
            context.moveTo(20, 120);
            context.lineTo(250, 120);
            context.stroke();
         }
      </script>
   </body>
</html>
Output
The output formed by the code is
The arcTo path element
This method draws an arc with the given points and uses the radius, connected to the previous point by a straight line.
arc(x, y, radius, startAngle, endAngle, counterclockwise)
The arc() method draws an arc that is centered at the point (x, y) with radius given as the third parameter. The arc is starting at startAngle and ends at endAngle going in the direction given as the last parameter.
The angles are measured from X-axis. If no direction is given in the last parameter, clockwise is used as default. Angles given in the arc() method are measured in radians only. So, we have to convert degrees to radians before giving input to the method. The last parameter counterclockwise is of Boolean datatype where the arc is drawn clockwise if given false and counterclockwise if given true. When the method arc() is called, just a path is declared and the drawing is done using the call of stroke() or fill(), which draws the arc as per the given path.
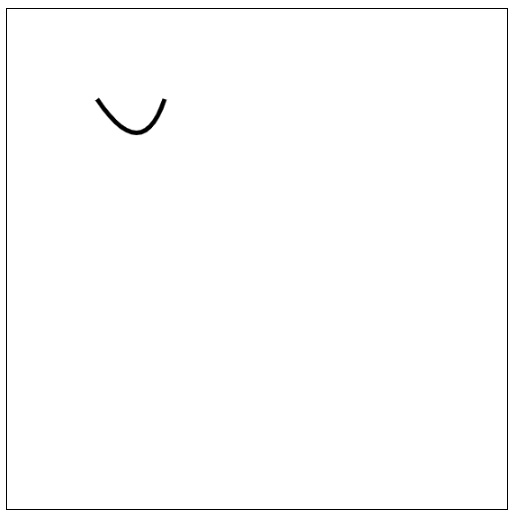
The quadraticCurveTo path element
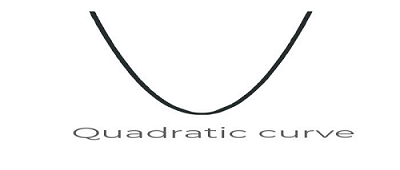
This method draws a quadratic Bezier curve from the current position to the endpoint given using point(x, y). The curve is drawn with reference to the control point specified by (p1, p2). An example of a quadratic curve is shown below.
Example
An example to implement quadratic curve is given below.
<!DOCTYPE html>
<html lang="en">
   <head>
      <title>quadratic curve</title>
      <style>
         body {
            margin: 10px;
            padding: 10px;
         }
      </style>
   </head>
   <body onload="curve();">
      <canvas id="canvas" width="555" height="555" style="border: 1px solid black;"></canvas>
      <script>
         function curve() {
            var canvas = document.getElementById('canvas');
            var context = canvas.getContext('2d');
            context.lineWidth = 5;
            context.beginPath();
            context.moveTo(100, 100);
            context.quadraticCurveTo(150, 175, 175, 100);
            context.stroke();
            context.closePath();
         }
      </script>
   </body>
</html>
Output
The curve generated for the above code is shown below.
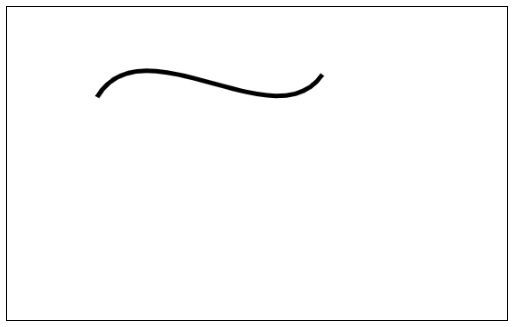
The bezierCurveTo path element
This method draws a cubic Bezier curve from the position of the end point (x, y), using control points specified by (p1, p2) and (p3, p4).
Example
Following example generates a Bezier curve with the given co-ordinates and contact points. The implementation of cubic Bezier curves is given below.
<!DOCTYPE html>
<html lang="en">
   <head>
      <title>Bezier curve</title>
      <style>
         body {
            margin: 10px;
            padding: 10px;
         }
      </style>
      </script>
   </head>
   <body onload="curve();">
      <canvas id="canvas" width="555" height="555" style="border: 1px solid black;"></canvas>
      <script>
         function curve() {
            var canvas = document.getElementById('canvas');
            var context = canvas.getContext('2d');
            context.lineWidth = 5;
            context.beginPath();
            context.moveTo(100, 100);
            context.bezierCurveTo(150, 15, 300, 150, 350, 75);
            context.stroke();
            context.closePath();
         }
      </script>
   </body>
</html>
Output
The Bezier curve generated for the above code is
HTML Canvas - 2D Shapes Using Path Elements
In this chapter we are going to discuss how to draw various 2D shapes using various path elements of HTML5.
There is a method named rect() used to create rectangles in the Canvas element. It uses the concept of the path, and its syntsx isrect(x, y, width, height)
This method draws a rectangle whose top-left corner is specified by (x, y) with a given width and height. To execute this method, moveTo() must be called with parameters x and y so the pointer moves to the coordinates from which the rectangle can be drawn.
In the same way we can create other 2D shapes using these path elements.The steps involved in making shapes using paths in the Canvas element areStep 1 − Creating the path: This step is usually done using the beginPath() function which creates the path by which the actual shape is constructed.
Step 2 − Using drawing commands to draw into the path: To draw a shape using Canvas, we use functions like lineTo() and moveTo() to draw the required path.
Step 3 − Use methods like stroke or fill to construct the shape: After drawing the path, we use fill() and stroke() methods to make the path shape generated more understandable. Then we will complete the path by using the closePath() function.
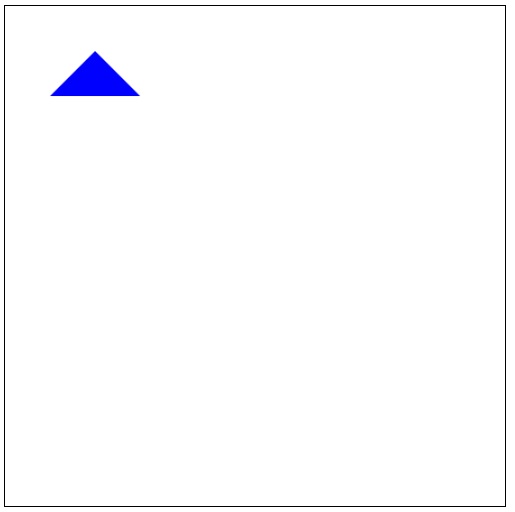
Drawing Triangles
Mathematically, the Intersection of three lines is considered a triangle. It consists of three intersected lines at a particular angle. The intersected lines are called vertices of the triangle.
To draw a triangle, we must use Path functions. The triangle is drawn using three lines by the lineTo() function. We first begin the path and move to the point where we draw a line and then use lineTo() until a triangle is formed. We must make sure the coordinates given to the functions must form a triangle. We can add properties to the triangle formed by using the required functions such as shape, gradient, etc.
The syntax of lineTo() function isCanvas.lineTo(x, y);
Where the parameters involved are x and y which denotes the point to which the line is to be drawn. We have to first initialize the starting point using the moveTo() function.
Example
Following example draws a triangle using path operations. The program code is given below
<!DOCTYPE html>
<html lang="en">
<head>
   <title>Triangle</title>
</head>
<body onload="triangle();">
   <canvas id="canvas" width="555" height="555" style="border: 1px solid black;"></canvas>
   <script>
      function triangle() {
         var canvas = document.getElementById('canvas');
         if (canvas.getContext) {
            var ctx = canvas.getContext('2d');
            ctx.beginPath();
            ctx.moveTo(50, 100);
            ctx.lineTo(100, 50);
            ctx.lineTo(150, 100);
            ctx.lineTo(50, 100);
            ctx.fillStyle = "blue";
            ctx.fill()
         }
      }
   </script>
</body>
</html>
Output
The triangle formed for the above code is shown below. We can play with the coordinates and make other triangles such as right-angled and isosceles triangles. We can also add the closePath() function at the end. If we do not give closePath() at the end of the script, the path is still running and is not stopped.
Drawing Lines
A line is a shape formed when two points are joined with a minimum distance between them. It is a common mathematical shape that is used to draw most of the shapes in geometry.
To draw a line using HTML5 Canvas by using Paths, we should use two methods, moveTo(x, y) and lineTo(x, y). To identify the line on Canvas, we must use stroke() or fill(). The moveTo() method defines the position of the cursor to draw on the canvas, whereas the lineTo() method defines the coordinates of the end point of the line, and the stroke() or fill() method is used to make the line visible on the canvas element. The color of stroke() or fill() is black unless specified by the user.
The syntax of the functions used to draw the line are
Canvas.moveTo(x,y);
The canvas cursor is moved from the origin to the point (x, y).
Canvas.lineTo(x, y);
A line is drawn from the cursor point to the given parameter points (x, y).
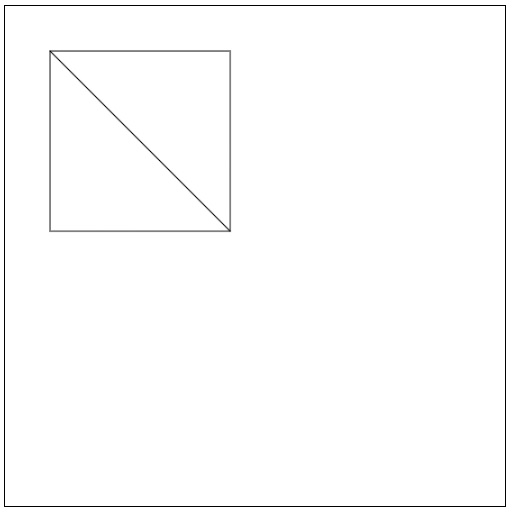
Example
We will work on some examples to understand it clearly. The following example will take a square on canvas and draw its diagonal using lines. The implementation is given below.
<!DOCTYPE html>
<html lang="en">
   <head>
      <title>Line-Diagonal</title>
      <style>
         <style>body {
            margin: 10px;
            padding: 10px;
         }
      </style>
   </head>
   <body onload="line1();">
      <canvas id="canvas" width="555" height="555" style="border: 1px solid black;"></canvas>
      <script>
         function line1() {
            var canvas = document.getElementById('canvas');
            var context = canvas.getContext('2d');
            var x = 50;
            var y = 50;
            var width = 200;
            var height = 200;
            context.strokeRect(x, y, width, height);
            context.moveTo(50, 50);
            context.lineTo(250, 250);
            context.stroke();
         }
      </script>
   </body>
</html>
Output
We have first constructed a square using a rectangle on canvas with its dimensions given above and drawn a line from its top-left coordinates (x, y) to the bottom right coordinates adding the x and y values (x+width, y+height) as they are away from the origin. Refer to Canvas coordinates to understand this clearly. The output for the above code is given below.
Example
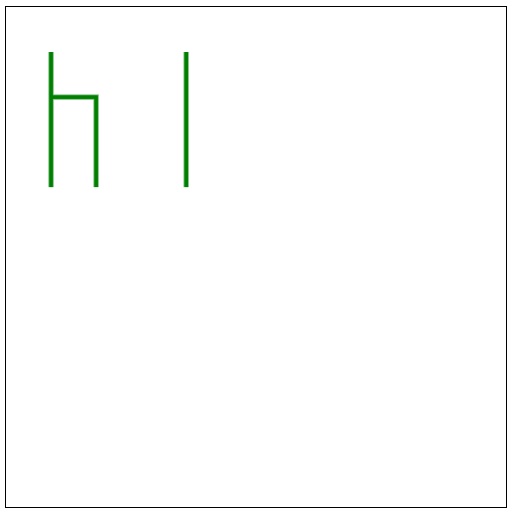
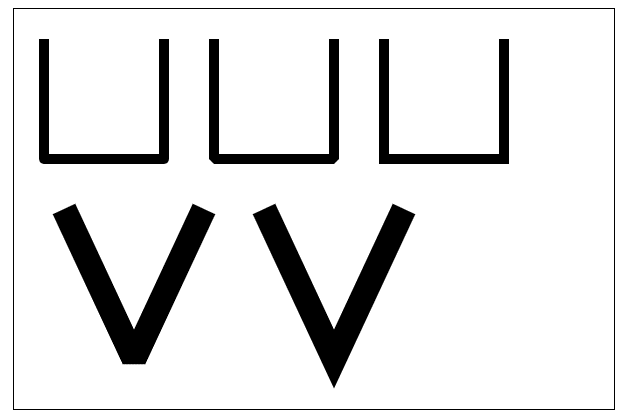
We will work on another example in which only lines are drawn. Let us draw the letters 'h' and 'i' using the lines. We will be using lineWidth() and strokeStyle() to make the output easily understandable and make it look attractive. The code for the program is given below.
<!DOCTYPE html>
<html lang="en">
   <head>
      <title>Line-'hI'</title>
      <style>
         body {
            margin: 10px;
            padding: 10px;
         }
      </style>
   </head>
   <body onload="line2();">
      <canvas id="canvas" width="555" height="555" style="border: 1px solid black;"></canvas>
      <script>
         function line2() {
            var canvas = document.getElementById('canvas');
            var context = canvas.getContext('2d');
            context.lineWidth = 5.0;
            context.beginPath();
            context.strokeStyle = 'green';
            context.moveTo(50, 50);
            context.lineTo(50, 200);
            context.lineTo(50, 100);
            context.lineTo(100, 100);
            context.lineTo(100, 200);
            context.stroke();
            context.beginPath();
            context.strokeStyle = 'green';
            context.moveTo(200, 50);
            context.lineTo(200, 200);
            context.stroke();
         }
      </script>
   </body>
</html>
Output
The output of the following code is shown below. We can create text using lines in the Canvas element, but it is very difficult to implement. Canvas also has text drawing functions to make it easier to work on. We will be using text in the later part of the tutorial.
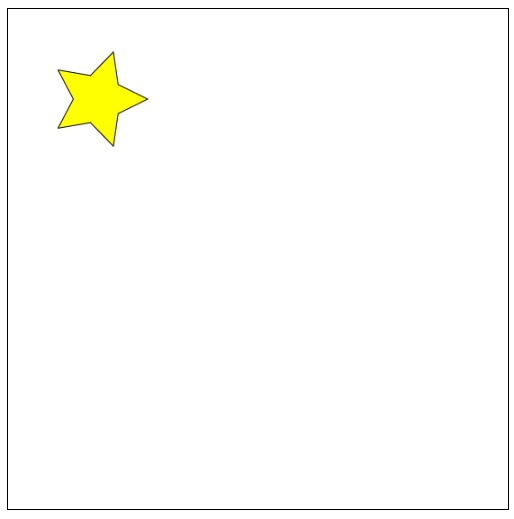
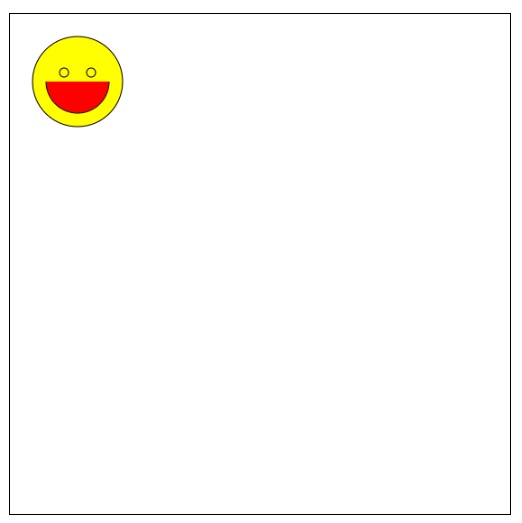
An interesting star shape using lines
We will draw stars using path methods. Star can be simply drawn by combining a group of lines with the help of path objects. We have to write a JavaScript function that takes input and gives the output as the star. The function which draws stars is the star(R, X, Y, N) where R is the center of a star, X and Y are centered coordinates, and N is the number of spikes needed to be drawn on the star. The implementation is given below.
Example
<!DOCTYPE html>
<html lang="en">
   <head>
      <title>Star</title>
      <style>
         body {
            margin: 10px;
            padding: 10px;
         }
      </style>
   </head>
   <body onload="star();">
      <canvas id="canvas" width="555" height="555" style="border: 1px solid black;"></canvas>
      <script>
         var ctx = document.getElementById("canvas").getContext("2d");

         function star(R, X, Y, N) {
            ctx.beginPath();
            ctx.moveTo(X + R, Y);
            for (var i = 1; i <= N * 2; i++) {
               if (i % 2 == 0) {
                  var theta = i * (Math.PI * 2) / (N * 2);
                  var x = X + (R * Math.cos(theta));
                  var y = Y + (R * Math.sin(theta));
               } else {
                  var theta = i * (Math.PI * 2) / (N * 2);
                  var x = X + ((R / 2) * Math.cos(theta));
                  var y = Y + ((R / 2) * Math.sin(theta));
               }
               ctx.lineTo(x, y);
            }
            ctx.closePath();
            ctx.fillStyle = "yellow";
            ctx.fill();
            ctx.fillStyle = "green";
            ctx.stroke();
         }
         star(55, 100, 100, 5);
      </script>
   </body>
</html>
Output
The star formed on the canvas is shown below.
Drawing Arcs
To draw any shape with arcs, we have to use two available methods arc() and arcTo(). Let us understand how each method is functions.
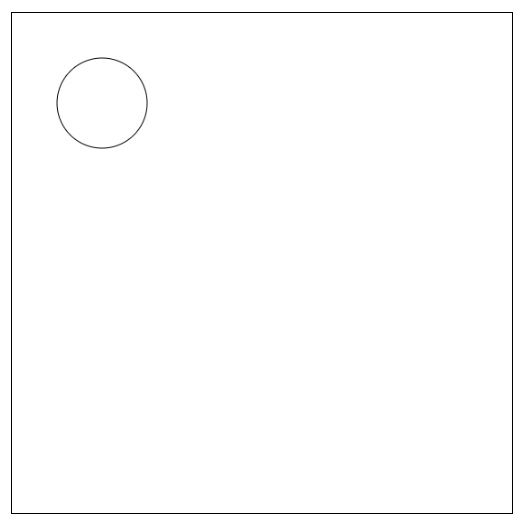
Drawing Circle using Arc
We can draw a circle using Arcs very easily. The effective way to draw a circle is to use arc() and beginPath() methods. The implementation of Circle is given below.
Example
<!DOCTYPE html>
<html lang="en">
   <head>
      <meta charset="UTF-8">
      <meta http-equiv="X-UA-Compatible" content="IE=edge">
      <meta name="viewport" content="width=device-width, initial-scale=1.0">
      <title>arc()</title>
      <style>
         body {
            margin: 10px;
            padding: 10px;
         }
      </style>
   </head>
   <body onload="circle();">
      <canvas id="canvas" width="555" height="555" style="border: 1px solid black;"></canvas>
      <script>
         function circle() {
            var canvas = document.getElementById('canvas');
            var context = canvas.getContext('2d');
            context.beginPath();
            context.arc(100, 100, 50, 1 * Math.PI, 5 * Math.PI);
            context.stroke();
         }
      </script>
   </body>
</html>
Output
This code draws a circle inside the canvas using the path() and arc() methods. Output for the code is shown below.
Drawing Curves
In mathematics, the curve is an abstract path used to describe a continuously moving point. Such paths are generated using an equation.
Curves are the most common mathematical representations which have many applications. These can be represented on Canvas using methods based on their contact points. The types of curves that can be drawn using Canvas are quadratic and cubic Bezier curves. The methods are given below.
How do Bezier quadratic and cubic differ?
The basic difference between quadratic and Bezier curves is that a quadratic Bezier curve has a start and an end point (x, y) and just a single control point while a cubic Bezier curve uses two control points with one end point (x,y).
Using these methods might be quite difficult to create complex shapes as we do not have any visual support while writing the code. So, it is advised to not use these methods to draw complex shapes until you excel in all the above methods.
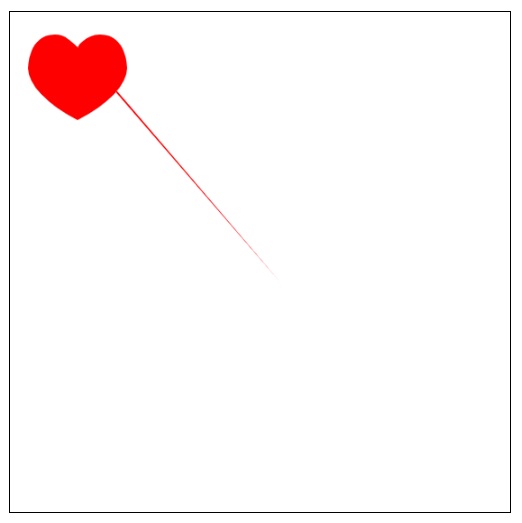
Simple heart program using curves
Let us draw a simple organic heart shape using curves. The code for the drawing is shown below.
Example
<!DOCTYPE html>
<html lang="en">
   <head>
      <meta charset="UTF-8">
      <meta http-equiv="X-UA-Compatible" content="IE=edge">
      <meta name="viewport" content="width=device-width, initial-scale=1.0">
      <title>Heart</title>
      <style>
         body {
            margin: 10px;
            padding: 10px;
         }
      </style>
   </head>
   <body onload="curve();">
      <canvas id="canvas" width="555" height="555" style="border: 1px solid black;"></canvas>
      <script>
         function curve() {
            var canvas = document.getElementById('canvas');
            var ctx = canvas.getContext('2d');
            ctx.lineWidth = 5;
            ctx.beginPath();
            ctx.moveTo(300, 300);
            ctx.bezierCurveTo(75, 37, 70, 25, 50, 25);
            ctx.bezierCurveTo(20, 25, 20, 62.5, 20, 62.5);
            ctx.bezierCurveTo(20, 80, 40, 102, 75, 120);
            ctx.bezierCurveTo(110, 102, 130, 80, 130, 62.5);
            ctx.bezierCurveTo(130, 62.5, 130, 25, 100, 25);
            ctx.bezierCurveTo(85, 25, 75, 37, 75, 40);
            ctx.fillStyle = "red";
            ctx.fill();
         }
      </script>
   </body>
</html>
Output
This code gives a red-colored heart with a diagonal line. The line is formed due to the input co-ordinates given in the functions as the point is outside of the shape. The heart drawn on the Canvas using the above code is
Combination of Shapes
We can draw a combination of one or more shapes on the Canvas element. The only thing that should be kept in mind is that the coordinates given are matched with the desired output. Since we combine one or more shapes, the values must be assigned accordingly. Refer to Grid to understand the concept of assigning coordinate values.
The face of the duck using Curves and arcs
We will draw a simple duck face drawing using Circles and arc. The face and eyes are drawn using circles, mouth using arc. Implementation using code is given below.
Example
<!DOCTYPE html>
<html lang="en">
   <head>
      <title>duck smile</title>
      <style>
         body {
            margin: 10px;
            padding: 10px;
         }
      </style>
   </head>
   <body onload="smile();">
      <canvas id="canvas" width="555" height="555" style="border: 1px solid black;"></canvas>
      <script>
         function smile() {
            var canvas = document.getElementById('canvas');
            if (canvas.getContext) {
               var ctx = canvas.getContext('2d');
               ctx.beginPath();
               ctx.arc(75, 75, 50, 0, Math.PI * 2, true);
               ctx.moveTo(110, 75);
               ctx.fillStyle = "red";
               ctx.fill();
               ctx.arc(75, 75, 35, 0, Math.PI, false);
               ctx.moveTo(65, 65);
               ctx.fillStyle = "yellow";
               ctx.fill();
               ctx.arc(60, 65, 5, 0, Math.PI * 2, true);
               ctx.moveTo(95, 65);
               ctx.arc(90, 65, 5, 0, Math.PI * 2, true);
               ctx.stroke();
            }
         }
      </script>
   </body>
</html>
Output
Path 2D
We can use any number of paths and commands to draw objects onto canvas. To make it easy, Path2D is introduced by the Canvas which helps us to construct the drawing easily. The Path2D constructor returns initialized path object, with another path as an argument. Let us implement the Path2D object in a program.
Example
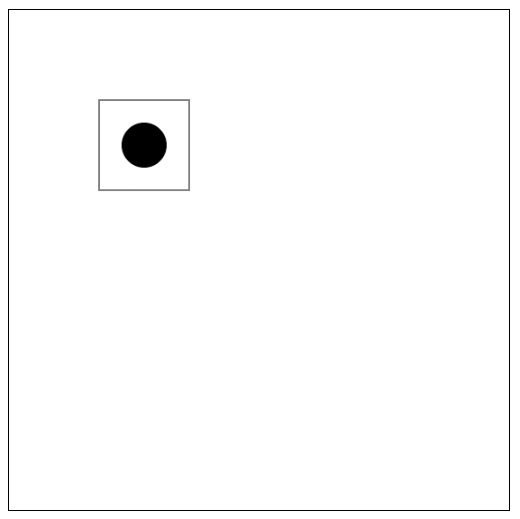
The following example inserts a circle into square using Path2D object. The implementation is given below.
<!DOCTYPE html>
<html lang="en">
   <head>
      <title>Path2D</title>
      <style>
         body {
            margin: 10px;
            padding: 10px;
         }
      </style>
      <script>
         function draw() {
            var canvas = document.getElementById('canvas');
            if (canvas.getContext) {
               var ctx = canvas.getContext('2d');
               var rectangle = new Path2D();
               rectangle.rect(100, 100, 100, 100);
               var circle = new Path2D();
               circle.arc(150, 150, 25, 0, 2 * Math.PI);
               ctx.stroke(rectangle);
               ctx.fill(circle);
            }
         }
      </script>
   </head>
   <body onload="draw();">
      <canvas id="canvas" width="555" height="555" style="border: 1px solid black;"></canvas>
   </body>
</html>
Output
The output for the code is shown below
HTML Canvas - Colors
In the previous chapter, we have just focused on drawing shapes on the Canvas using basic styles. In this and the next chapters, we will focus on how to make the shapes and Canvas elements attractive by using various styles.
We can perform various operations on the Canvas element and the graphics drawn inside it to make them attractive. The concepts which we use to achieve the required graphics by styles and colors are listed below. Each one of the properties has its own function and uses. We will be learning clearly about each of them in the next pages.
Colors
Transparency
Styles for lines
Gradients
Patterns
Shadows
Colors
Till now we have seen how to draw shapes on Canvas elements. Now we will be seeing how to add colors to the shapes drawn.
The properties available to apply colors to the Canvas element are listed in the below table.
| S.No | Property & Description |
|---|---|
| 1 | fillStyle This property is used to fill a color inside the shape. |
| 2 | strokeStyle This property is used to color the shape outline. |
The color property can be assigned in four types
Give the name of color directly
Eg − 'green', 'blue'
Give color input using hexadecimal values. All the colors are available in the range #000000 to #ffffff.
Give the color using RGB values.
Eg − rgb(0,5,10). The values of all colors are between rgb(0,0,0) to rgb(255,255,255).
Give the color input using RGBA values.
Eg − rgba(0,100,200,1)
Where
r − red component
g − green component
b − blue component
a − opacity value. The value is between 0 and 1 respectively.
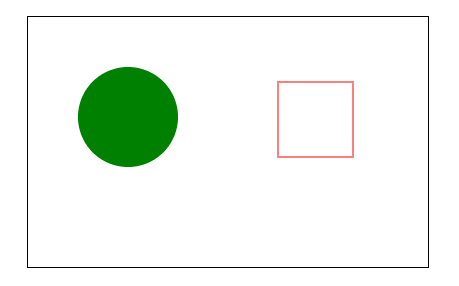
Example
Following example demonstrates fillStyle property on circle and strokeStyle on square. The implementation is given below.
<!DOCTYPE html>
<html lang="en">
   <head>
      <title>Color</title>
      <style>
         body {
            margin: 10px;
            padding: 10px;
         }
      </style>
   </head>
   <body onload="color();">
      <canvas id="canvas" width="400" height="250" style="border: 1px solid black;"></canvas>
      <script>
         function color() {
            var canvas = document.getElementById('canvas');
            var context = canvas.getContext('2d');
            // fillStyle for circle
            context.arc(100, 100, 50, 1 * Math.PI, 5 * Math.PI);
            context.fillStyle = 'green';
            context.fill();
            // strokeStyle for square
            context.beginPath();
            context.rect(250, 65, 75, 75);
            context.strokeStyle = 'red';
            context.stroke();
            context.closePath();
         }
      </script>
   </body>
</html>
Output
The important thing to remember while using the color properties is that when any property is given, it is applied to the whole shapes in the Canvas. To make the property applicable for only the specified shape, we must use beginPath() and closePath() for the shape. The output for the above code is
Transparency
Sometimes there is a need for the user to make his graphics transparent. The Canvas is equipped with the translucent property which can be done by using the globalAlpha property or by simply assigning transparency for the Canvas using 'rgba' in the color properties.
The property used to make the Canvas element transparent is globalAlpha. The syntax is given below
Canvas.globalAlpha = transparency_value
The transparency value lies between 0 and 1 where 0 indicates the shape is completely transparent and 1 indicates the shape is opaque. For any shape in the Canvas element, the transparency value is 1 (opaque) by default.
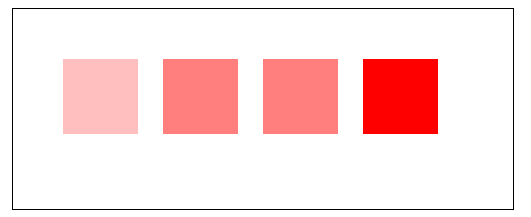
Example using globalAlpha
The following example takes the same square filled with red color and demonstrates their transparency at different globalAlpha levels. The implementation code is given below.
<!DOCTYPE html>
<html lang="en">
   <head>
      <title>Transparency</title>
      <style>
         body {
            margin: 10px;
            padding: 10px;
         }
      </style>
   </head>
   <body onload="transparency();">
      <canvas id="canvas" width="500" height="200" style="border: 1px solid black;"></canvas>
      <script>
         function transparency() {
            var canvas = document.getElementById('canvas');
            var context = canvas.getContext('2d');
            // square with 0.25 transparency
            context.beginPath();
            context.rect(50, 50, 75, 75);
            context.globalAlpha = 0.25;
            context.fillStyle = 'red';
            context.fill();
            context.closePath();
            // square with 0.5 transparency
            context.beginPath();
            context.rect(150, 50, 75, 75);
            context.globalAlpha = 0.5;
            context.fillStyle = 'red';
            context.fill();
            context.closePath();
            // square with 0.75 transparency
            context.beginPath();
            context.rect(250, 50, 75, 75);
            context.fillStyle = 'red';
            context.fill();
            context.closePath();
            // square with 1 transparency
            context.beginPath();
            context.rect(350, 50, 75, 75);
            context.globalAlpha = 1;
            context.fillStyle = 'red';
            context.fill();
            context.closePath();
         }
      </script>
   </body>
</html>
Output
The output for the following code is
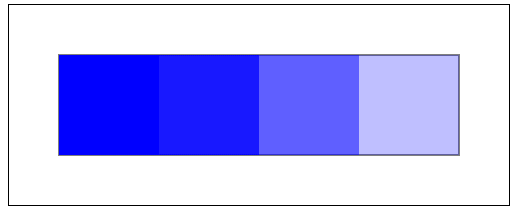
Example using color properties
We use rgba color for the Canvas color properties and demonstrate the color property in the below example. The implementation is given below.
<!DOCTYPE html>
<html lang="en">
   <head>
      <title>Transparency</title>
      <style></style>
   </head>
   <body onload="transparency();">
      <canvas id="canvas" width="500" height="200" style="border: 1px solid black;"></canvas>
      <script>
         function transparency() {
            var canvas = document.getElementById('canvas');
            var context = canvas.getContext('2d');
            context.rect(50, 50, 400, 100);
            context.strokeStyle = 'black';
            context.stroke();
            context.beginPath();
            context.rect(50, 50, 100, 100);
            context.fillStyle = 'rgba(0,0,255,1)';
            context.fill();
            context.closePath();
            context.beginPath();
            context.rect(50, 50, 200, 100);
            context.fillStyle = 'rgba(0,0,255,0.75)';
            context.fill();
            context.closePath();
            context.beginPath();
            context.rect(50, 50, 300, 100);
            context.fillStyle = 'rgba(0,0,255,0.50)';
            context.fill();
            context.closePath();
            context.beginPath();
            context.rect(50, 50, 400, 100);
            context.fillStyle = 'rgba(0,0,255,0.25)';
            context.fill();
            context.closePath();
         }
      </script>
   </body>
</html>
Output
The output for the following code is
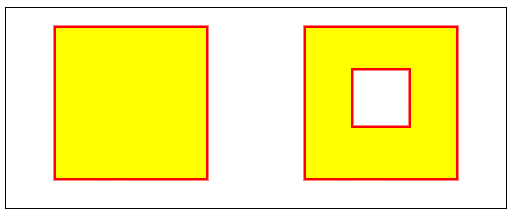
Rules to fill colors in Canvas
We have used the fill() method so many times in previous chapters which does not take any parameters. We can include parameters to the function to make some complex fill shapes. While using fill(), we can optionally provide a specific algorithm to determine the point position and to whether fill it or not. Two types of values can be passed to the function which is given below.
nonzero − This is the default rule for the fill function which finds out whether the point or shape lies outside the path or not but fills all the available objects.
evenodd −This finds out whether to fill the shape or area available in the path and fills the shape available in an even odd manner.
Example
Let us make two nested squares and find out how each of the value is working. The implementation code is given below.
<!DOCTYPE html>
<html lang="en">
   <head>
      <title>canvas fill rules</title>
      <style>
         body {
            margin: 10px;
            padding: 10px;
         }
      </style>
   </head>
   <body onload="fill();">
      <canvas id="canvas" width="500" height="200" style="border: 1px solid black;"></canvas>
      <script>
         function fill() {
            var canvas = document.getElementById('canvas');
            var context = canvas.getContext('2d');
            // using nonzero
            context.beginPath();
            context.rect(95, 60, 60, 60);
            context.rect(50, 20, 150, 150);
            context.lineWidth = 5;
            context.strokeStyle = 'red';
            context.stroke();
            context.fillStyle = 'yellow';
            context.fill('nonzero');
            context.closePath();
            // using evenodd
            context.beginPath();
            context.rect(345, 60, 60, 60);
            context.rect(300, 20, 150, 150);
            context.lineWidth = 5;
            context.strokeStyle = 'red';
            context.stroke();
            context.fillStyle = 'yellow';
            context.fill('evenodd');
            context.closePath();
         }
      </script>
   </body>
</html>
Output
The output for the above code is
HTML Canvas - Adding Styles
Similar to colors we can also add various stlyes to difference shapes available in HTML5 Canvas. Let us see them one by one.
Styles to Lines
One way to draw a line in HTML5 is to use the lineTo path element. We can also beautify these lines using the various style properties.
Since most of the objects we create on canvas are drawn using lines we can stryle these objects using the line properties. The properties that are used for styling lines are listed in the below table.
| S.No | Property & Description | Sample image |
|---|---|---|
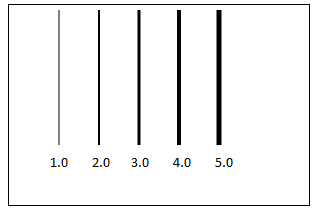
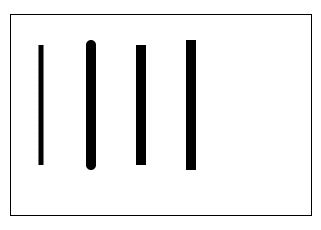
| 1 | ineWidth The width of the lines drawn can be assigned using this property. The thickness value of any line by default is 1 unit. |
 |
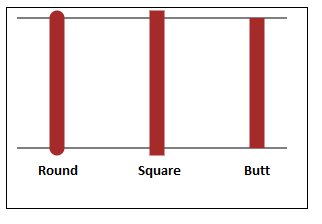
| 2 | lineCap This property is generally used to style the ends of the line. There are three accepted input values for the property which are 'butt', 'round' and 'square'. The default value is always 'butt'. |
 |
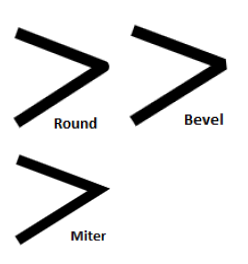
| 3 | lineJoin When two lines are about to be joined, this property can be used to set the appearance of the corners where lines are joined. The values accepted by the property are 'miter', 'bevel', and 'round'. The default value of the property is 'miter'. The property does not affect the lines as there is no joining area added. |
|
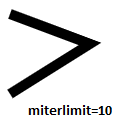
| 4 | miterLimit The thickness of the junction is changed using the property when two angles join at a sharp angle. This property determines the distance of outside connection to which inside connection point can be placed. The default value is 10 but the possible values completely depend on the lines used. |
 |
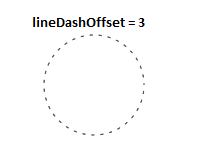
| 5 | lineDashOffset This specifies the dash pattern for the lines. This is used to make dotted and dash lined patterns. We can also use it in setLineDash() method and create animation effects. |
 |
Apart from these properties, two other methods can be used to apply styles for lines.
The getLineDash() method − This returns the current line-dash pattern containing an even number of positive numbers.
The setLineDash() method − To set the dash lines to create a shape or pattern using Canvas, this method is used. It takes segment array as inputs which consist of some line values. If nothing is given, a simple stroked line is given as output.
Example
Following code demonstrates lineWidth and lineCap properties. The implementation is given below.
<!DOCTYPE html>
<html lang="en">
   <head>
      <title>Styling lines</title>
      <style></style>
   </head>
   <body onload="linestyles();">
      <canvas id="canvas" width="300" height="200" style="border: 1px solid black;"></canvas>
      <script>
         function linestyles() {
            var canvas = document.getElementById("canvas");
            var context = canvas.getContext('2d');
            // lineWidth property
            context.moveTo(30, 30);
            context.lineTo(30, 150);
            context.lineWidth = 5;
            context.stroke();
            // linecap round property
            context.beginPath();
            context.moveTo(80, 30);
            context.lineTo(80, 150);
            context.lineWidth = 10;
            context.lineCap = 'round';
            context.stroke();
            context.closePath();
            // linecap butt property
            context.beginPath();
            context.moveTo(130, 30);
            context.lineTo(130, 150);
            context.lineWidth = 10;
            context.lineCap = 'butt';
            context.stroke();
            context.closePath();
            // linecap square property
            context.beginPath();
            context.moveTo(180, 30);
            context.lineTo(180, 150);
            context.lineWidth = 10;
            context.lineCap = 'square';
            context.stroke();
            context.closePath();
         }
      </script>
   </body>
</html>
Output
The output for the following code is given below.
Example
Following code demonstrates the lineJoin and miterlimit properties. The miterlimit property is demonstrated with values '2 units' and '20 units' respectively. The code is given below.
<!DOCTYPE html>
<html lang="en">
   <head>
      <title>Styling lines</title>
      <style></style>
   </head>
   <body onload="linestyles();">
      <canvas id="canvas" width="600" height="400" style="border: 1px solid black;"></canvas>
      <script>
         function linestyles() {
            var canvas = document.getElementById("canvas");
            var context = canvas.getContext('2d');
            // linejoin round property
            context.moveTo(30, 30);
            context.lineTo(30, 150);
            context.lineTo(150, 150);
            context.lineTo(150, 30);
            context.lineJoin = 'round';
            context.lineWidth = 10;
            context.stroke();
            // linejoin bevel property
            context.beginPath();
            context.moveTo(200, 30);
            context.lineTo(200, 150);
            context.lineTo(320, 150);
            context.lineTo(320, 30);
            context.lineJoin = 'bevel';
            context.lineWidth = 10;
            context.stroke();
            context.closePath();
            // linejoin miter property
            context.beginPath();
            context.moveTo(370, 30);
            context.lineTo(370, 150);
            context.lineTo(490, 150);
            context.lineTo(490, 30);
            context.lineJoin = 'miter';
            context.lineWidth = 10;
            context.stroke();
            context.closePath();
            // miterlimit property with value 2
            context.beginPath();
            context.moveTo(50, 200);
            context.lineTo(120, 350);
            context.lineTo(190, 200);
            context.miterLimit = 2;
            context.lineJoin = 'miter';
            context.lineWidth = 25;
            context.stroke();
            context.closePath();
            // miterlimit property with value 20
            context.beginPath();
            context.moveTo(250, 200);
            context.lineTo(320, 350);
            context.lineTo(390, 200);
            context.miterLimit = 20;
            context.lineJoin = 'miter';
            context.lineWidth = 25;
            context.stroke();
            context.closePath();
         }
      </script>
   </body>
</html>
Output
Following code gives the output as
Example
The following example uses setLineDash method and lineDashOffset property value to specify dish patterns for drawing shapes using lines. The implementation code is given below.
<!DOCTYPE html>
<html lang="en">
   <head>
      <title>Styling lines</title>
      <style></style>
   </head>
   <body onload="linestyles();">
      <canvas id="canvas" width="350" height="200" style="border: 1px solid black;"></canvas>
      <script>
         function linestyles() {
            var canvas = document.getElementById("canvas");
            var ctx = canvas.getContext('2d');
            var offset = 0;

            function draw() {
               ctx.clearRect(0, 0, canvas.width, canvas.height);
               ctx.setLineDash([50, 10]);
               ctx.lineDashOffset = offset;
               ctx.strokeRect(10, 10, 250, 125);
            }

            function animate() {
               offset++;
               if (offset > 25) {
                  offset = 0;
               }
               draw();
               setTimeout(animate, 50);
            }
            animate();
         }
      </script>
   </body>
</html>
Output
The code returns the output as shown below. Paste the code in the editor to see the animation effect.
Gradients
We can simply fill and stroke shapes using gradients just like drawing a shape on a Canvas element. There are three types of gradients available in Canvas, they are linear, radial, and conic. We can create gradient objects using three methods. Each method is listed in the below table.
| S.No | Method & Description |
|---|---|
| 1 | createLinearGradient(x1, y1, x2, y2) Creates a linear gradient object having starting point as (x1,y1) and an end point as (x2,y2). |
| 2 | createRadialGradient(x1, y1, r1, x2, y2, r2) This method is used for creating a radial gradient object. It takes two circles as its parameters where the first circle radius is r1 and the center co-ordinates are (x1,y1). The second circle radius is r2 and its center co-ordinates are (x2,y2). |
| 3 | createConicGradient(angle, x, y) To create a conic gradient object, this method is used which takes the starting angle in radians and the position point (x, y) as its parameters. |
After creating a canvas gradient object, we can color it using the addColorStop() method. Its syntax and parameters are given below.
Canvas.addColorStop(position, color) − It creates a color stop for the canvas object created. The parameter position takes values between 0 and 1 which defines the position of color in the gradient. The color parameter is the color input that is rendered to the gradient object. There is no limit on the number of color stops for the single gradient object.
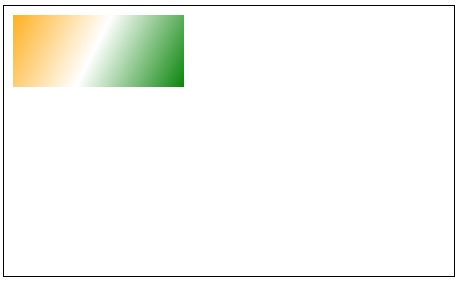
Example 1 (linear gradient)
Following example shows how linear gradient is implemented. The code is given below.
<!DOCTYPE html>
<html lang="en">
   <head>
      <title>Gradients</title>
      <style></style>
   </head>
   <body onload="gradients();">
      <canvas id="canvas" width="500" height="300" style="border: 1px solid black;"></canvas>
      <script>
         function gradients() {
            var canvas = document.getElementById("canvas");
            var context = canvas.getContext('2d');
            // linear gradient
            var lineargrad = context.createLinearGradient(0, 0, 200, 100);
            context.fillStyle = lineargrad;
            lineargrad.addColorStop(0, 'orange');
            lineargrad.addColorStop(0.5, 'white');
            lineargrad.addColorStop(1, 'green');
            context.fillRect(10, 10, 190, 80);
         }
      </script>
   </body>
</html>
Output
The linear gradient object formed from the above code is
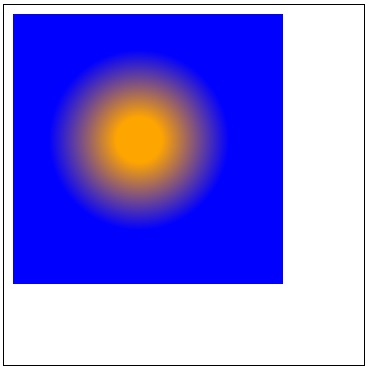
Example 2 (radial-gradient)
Following code demonstrates how a radial gradient is implemented in the Canvas element. We take two circles have same centers but different radius and colors to show the gradients.
<!DOCTYPE html>
<html lang="en">
   <head>
      <title>Gradients</title>
      <style></style>
   </head>
   <body onload="gradients();">
      <canvas id="canvas" width="400" height="400" style="border: 1px solid black;"></canvas>
      <script>
         function gradients() {
            var canvas = document.getElementById("canvas");
            var context = canvas.getContext('2d');
            var radialgrad = context.createRadialGradient(150, 150, 25, 150, 150, 100);
            radialgrad.addColorStop(0, 'orange');
            radialgrad.addColorStop(1, 'blue');
            context.fillStyle = radialgrad;
            context.fillRect(10, 10, 300, 300);
         }
      </script>
   </body>
</html>
Output
The output generated by the above code is
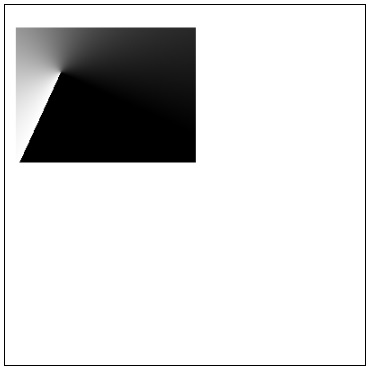
Example 3 (conic gradient)
The following example shows how conic gradient can build a gradient object that looks like a 3D element. It is actually a 2D shape. The implementation is given below.
<!DOCTYPE html>
<html lang="en">
   <head>
      <title>Gradients</title>
      <style></style>
   </head>
   <body onload="gradients();">
      <canvas id="canvas" width="400" height="400" style="border: 1px solid black;"></canvas>
      <script>
         function gradients() {
            var canvas = document.getElementById("canvas");
            var context = canvas.getContext('2d');
            var conicgradient = context.createConicGradient(2, 62, 75);
            conicgradient.addColorStop(0, 'white');
            conicgradient.addColorStop(0.75, 'black');
            context.fillStyle = conicgradient;
            context.fillRect(12, 25, 200, 150);
         }
      </script>
   </body>
</html>
Output
The gradient object formed for the above code is
Patterns
Paintings are drawn on Canvas. Hence the name Canvas element is coined in HTML5. The Canvas element can be used to draw and design various patterns using pattern methods which are very attractive and has huge applications. It is commonly used in interior house designing. Image patterns can be drawn by this property on the Canvas element. The method used to create a pattern is given below
createPattern(image, type)
This method creates a Canvas pattern object which generates the image many times in the given space inside the Canvas. The parameter 'image' takes an image, and video as an input and makes it a pattern. There are four possible string inputs for the 'type' parameter and are listed below
repeat − this prints the input image in both horizontal and vertical positions.
repeat-x − the image is only repeated horizontally across the Canvas element.
repeat-y − the image is repeated vertically but not horizontally.
no-repeat − the image is not repeated and is used only once.
This method only works when the image is loaded before it is called. If the image is not loaded, the pattern is drawn incorrectly which may lead to some errors resulting in not displaying the pattern.
Example
Let us create a pattern using the method. Following shows the implementation
<html lang="en">
   <head>
      <title>Pattern</title>
      <style>
         #canvas {
            background-color: black;
         }
      </style>
   </head>
   <body onload="pattern();">
      <canvas id="canvas" width="555" height="555" style="border: 1px solid black;"></canvas>
      <script>
         function pattern() {
            var canvas = document.getElementById('canvas');
            var context = canvas.getContext('2d')
            var image = new Image();
            image.src = 'https://www.tutorialspoint.com/themes/home/tp-diamond-logo-white.png';
            image.onload = function() {
               // change type parameter in the method to see how the pattern is displayed.
               var pattern = context.createPattern(image, 'repeat');
               context.fillStyle = pattern;
               context.fillRect(0, 0, canvas.width, canvas.height);
            }
         }
      </script>
   </body>
</html>
Output
The pattern generated by the above code is given below
Shadows
Shadows make the shapes drawn inside the Canvas element more animative. Four properties can be applied to the Canvas element to use shadows. They are listed below
shadowOffsetX − The property takes the float value and indicates the horizontal distance of the shadow from the shape. The default value is 0 and the property value does not get affected by the transformation matrix. Using negative values makes the shadow move to the left of the shape.
shadowOffsetY − This property indicates at how much distance the shadow must be extended vertically. It takes float values, and the default value is 0. Using negative values makes the shadow move to the top. Like the above property, it is not affected by the transformation matrix.
shadowBlur − It indicates how blurred the shadow should be. It takes the float value as the input. The default value is 0 and it does not indicate the pixel numbers.
shadowColor − It takes standard CSS color as the input and applies it for the shadow effect. It is transparent black by default.
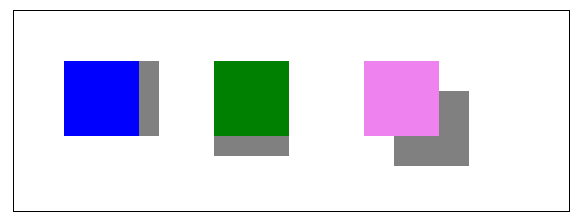
Example
The following example demonstrate shadow offset X and Y properties of shadow in three different shapes. The first square shows how shadowOffsetX is used, second square shows how shadowOffsetY is implemented, and the third square uses both the properties. The code is given below.
<!DOCTYPE html>
<html lang="en">
   <head>
      <title>shadow</title>
      <style>
         body {
            margin: 10px;
            padding: 10px;
         }
      </style>
   </head>
   <body onload="shadow();">
      <canvas id="canvas" width="555" height="200" style="border: 1px solid black;"></canvas>
      <script>
         function shadow() {
            var canvas = document.getElementById('canvas');
            var context = canvas.getContext('2d');
            // using shadow offset x
            context.beginPath();
            context.shadowOffsetX = 20;
            context.shadowColor = 'grey';
            context.rect(50, 50, 75, 75);
            context.fillStyle = 'blue';
            context.fill();
            context.closePath();
            // using shadow offset y
            context.beginPath();
            context.shadowOffsetX = 0;
            context.shadowOffsetY = 20;
            context.shadowColor = 'grey';
            context.rect(200, 50, 75, 75);
            context.fillStyle = 'green';
            context.fill();
            context.closePath();
            // using shadow offset x and y
            context.beginPath();
            context.shadowOffsetX = 30;
            context.shadowOffsetY = 30;
            context.shadowColor = 'grey';
            context.rect(350, 50, 75, 75);
            context.fillStyle = 'violet';
            context.fill();
            context.closePath();
         }
      </script>
   </body>
</html>
Output
The shadows formed for the above code is
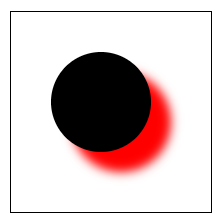
Example
Following code implements the shadowBlur and shadowColor properties to the Canvas element.
<!DOCTYPE html>
<html lang="en">
   <head>
      <meta charset="UTF-8">
      <meta http-equiv="X-UA-Compatible" content="IE=edge">
      <meta name="viewport" content="width=device-width, initial-scale=1.0">
      <title>shadow</title>
      <style>
         body {
            margin: 10px;
            padding: 10px;
         }
      </style>
   </head>
   <body onload="shadow();">
      <canvas id="canvas" width="200" height="200" style="border: 1px solid black;"></canvas>
      <script>
         function shadow() {
            var canvas = document.getElementById('canvas');
            var context = canvas.getContext('2d');
            context.shadowOffsetX = 20;
            context.shadowOffsetY = 20;
            context.shadowBlur = 10;
            context.shadowColor = 'red';
            context.arc(90, 90, 50, 1 * Math.PI, 5 * Math.PI);
            context.fillStyle = 'black';
            context.fill();
         }
      </script>
   </body>
</html>
Output
The output for the above code is
HTML Canvas - Adding Text
We have seen how to draw shapes as well as style them inside the Canvas element. We will now have a look at how to draw text in the Canvas element.
Drawing Text
To render text on the Canvas element, there are two methods available and are listed in the below table.
| S.No | Method & Description |
|---|---|
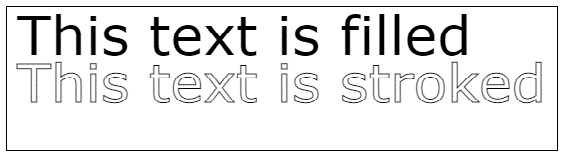
| 1 | fillText(text, x, y, maximum_width) When this method is used, the given text is inserted into the Canvas at position (x, y) and is filled. We can leave the maximum width parameter without assigning a value (or) give a value to draw text with the given width. |
| 2 | strokeText (text, x, y, maximum_idth) This method draws stroked text at the given position (x, y) inside the Canvas element. We can also give a width parameter to draw for the text or leave it where default size is considered. |
Example
Let us use font property to draw the text by the text drawing methods to understand it clearly. The following code demonstrates how text is drawn on the Canvas using the available methods.
<!DOCTYPE html>
<html lang="en">
   <head>
      <title>drawing text</title>
      <style>
         body {
            margin: 10px;
            padding: 10px;
         }
      </style>
   </head>
   <body onload="text();">
      <canvas id="canvas" width="550" height="150" style="border: 1px solid black;"></canvas>
      <script>
         function text() {
            var canvas = document.getElementById('canvas');
            var context = canvas.getContext('2d');
            context.font = '55px Verdana';
            context.fillText('This text is filled', 10, 50);
            context.strokeText('This text is stroked', 10, 100);
         }
      </script>
   </body>
</html>
Output
The output for the following code is
Styling text
We can style the text drawn on Canvas using the styling properties. We have already seen the font property in the above example. Four properties can be used to style text on Canvas and each of them is listed in the below table.
| S.No | Property & Description | Accepted Values |
|---|---|---|
| 1 | font The text size and font style are set using this property. The default value is 10px size and font style is sans-serif. The text size is taken in pixels and the font style is taken in string. If there is any error in initializing, the font property given is ignored. |
Canvas.font="text_size font_style"; |
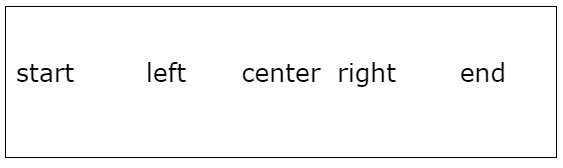
2 | textAlign This property can be used to set the position of text in Canvas. The default position of the text is 'start'. It only changes horizontal alignment. |
'start', 'end', 'left', 'right', 'center'. |
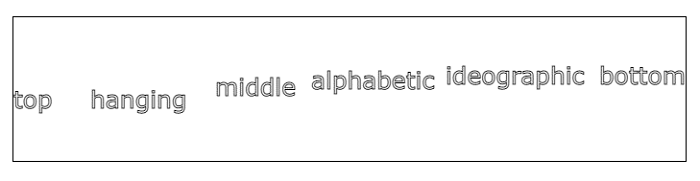
3 | textBaseline This property is used to alter the baseline alignment of the canvas text. The default value is 'alphabetic'. It sets the vertical alignment of the text. |
'top', 'hanging', 'middle', 'alphabetic', 'ideographic', 'bottom'. |
4 | direction It sets the directionality for the Canvas text. The default value is 'inherit'. |
'ltr', 'rtl', 'inherit'. |
Example 1
Following example demonstrates font and textAlign properties of text in HTML5 Canvas.
<!DOCTYPE html>
<html lang="en">
   <head>
      <title>styling text</title>
      <style>
         body {
            margin: 10px;
            padding: 10px;
         }
      </style>
   </head>
   <body onload="text();">
      <canvas id="canvas" width="550" height="150" style="border: 1px solid black;"></canvas>
      <script>
         function text() {
            var canvas = document.getElementById('canvas');
            var context = canvas.getContext('2d');
            context.font = "25px Verdana";
            context.textAlign = "start";
            context.fillText(context.textAlign, 10, 75);
            context.textAlign = "end";
            context.fillText(context.textAlign, 500, 75);
            context.textAlign = "left";
            context.fillText(context.textAlign, 140, 75);
            context.textAlign = "right";
            context.fillText(context.textAlign, 390, 75);
            context.textAlign = "center";
            context.fillText(context.textAlign, 275, 75);
         }
      </script>
   </body>
</html>
Output
The following code returns output as
Example 2
Following code implements textBaseline property for all the available values.
<!DOCTYPE html>
<html lang="en">
   <head>
      <title>styling text</title>
      <style>
         body {
            margin: 10px;
            padding: 10px;
         }
      </style>
   </head>
   <body onload="text();">
      <canvas id="canvas" width="700" height="150" style="border: 1px solid black;"></canvas>
      <script>
         function text() {
            var canvas = document.getElementById('canvas');
            var context = canvas.getContext('2d');
            context.font = "25px Verdana";
            context.textBaseline = "top";
            context.strokeText(context.textBaseline, 0, 75);
            context.textBaseline = "hanging";
            context.strokeText(context.textBaseline, 80, 75);
            context.textBaseline = "middle";
            context.strokeText(context.textBaseline, 210, 75);
            context.textBaseline = "alphabetic";
            context.strokeText(context.textBaseline, 310, 75);
            context.textBaseline = "ideographic";
            context.strokeText(context.textBaseline, 450, 75);
            context.textBaseline = "bottom";
            context.strokeText(context.textBaseline, 610, 75);
         }
      </script>
   </body>
</html>
Output
The output for the following code is
Example 3
We will demonstrate text direction in the following example. The implementation code is given below.
<!DOCTYPE html>
<html lang="en">
   <head>
      <meta charset="UTF-8">
      <meta http-equiv="X-UA-Compatible" content="IE=edge">
      <meta name="viewport" content="width=device-width, initial-scale=1.0">
      <title>styling text</title>
      <style>
         body {
            margin: 10px;
            padding: 10px;
         }
      </style>
   </head>
   <body onload="text();">
      <canvas id="canvas" width="600" height="150" style="border: 1px solid black;"></canvas>
      <script>
         function text() {
            var canvas = document.getElementById('canvas');
            var context = canvas.getContext('2d');
            context.font = "25px Verdana";
            context.fillText('direction-', 150, 50);
            context.direction = 'rtl';
            context.fillText('direction-', 150, 130);
         }
      </script>
   </body>
</html>
Output
The output for the following code is
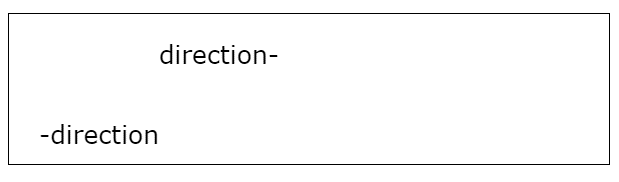
Measuring text
This method is used to obtain more details about the text. It allows us to measure the text. The method used to achieve this is measureText('text_string') - This method returns a text object containing the width of input text in pixels when drawn as the current style given.
Example
Following code demonstrates the measureText() method. The implementation is given below.
<!DOCTYPE html>
<html lang="en">
   <head>
      <title>styling text</title>
      <style>
         body {
            margin: 10px;
            padding: 10px;
         }
      </style>
   </head>
   <body onload="text();">
      <canvas id="canvas" width="600" height="150" style="border: 1px solid black;"></canvas>
      <script>
         function text() {
            var canvas = document.getElementById('canvas');
            var context = canvas.getContext('2d');
            context.font = "25px Verdana";
            context.strokeText("hello", 10, 50);
            var text = context.measureText('hello');
            window.alert(text.width);
         }
      </script>
   </body>
</html>
Output
The output returned by the code is
HTML Canvas - Adding Images
The best feature of the Canvas element is it can accept images and use them. Canvas element accepts all external image files to display on the webpage and we can use the images produced by other Canvas elements which are available on the same webpage. Importing an image to the Canvas is a two-step process
Retrieve the image using any of the available options.
Draw the image onto the canvas element using the drawImage() function.
Retrieving images
The Canvas API can use any of the following data types as an image source.
HTMLImageElement − These images are created using Image() constructor or the <img> tag of HTML.
SVGImageElement − The images are generally embedded using the <image> element.
HTMLVideoElement − It uses HTML <video> element as the image source and grabs the current video frame and uses it as the required image.
HTMLCanvasElement − We can use another Canvas element that is available on the same webpage as the image source. To retrieve images onto the Canvas element and use them, there are six possible ways, and each is mentioned below.
Images from the same page
We can obtain all the images available on the pages using the DOM model. To find all the available images, document.images collection must be accessed. To use one of the available images, we can use document.getElementsByTagName() method or document.getElementById() method if we know the ID of that specific image.
Images from other domains
To retrieve an image that is available in the other domain, we will use the tag and call the image to the Canvas element using the drawImage() function. Make sure the image is transferrable, or else the canvas may get tainted.
Images using other Canvas elements
When we retrieved the images available on same page using document.getElementsByTagName() or document.getElementById() method, we can use the same to retrieve images from other Canvas elements also. To achieve this, we must make sure the source canvas is already drawn before it is used by the target canvas.
Embedding the image using URL
To include an image to the canvas, we can directly add the image URL to the code and access it. The main advantages of using URL are that the image can be accessed very fast than other methods as it does not have to get server access again and make it portable to other locations. If the image is not perfectly accessed by URL, it might not be displayed on canvas. A simple code snippet to access the image using the URL is given below
// Creating an image element
var image = new Image();
// Accessing the image using URL
image.src = 'https://www.tutorialspoint.com/scripts/img/logo-footer.png';
Generate frames from video
We can get image frames from the video using <video> element. For example, if we have a video element having id as smallvideo, we can get frames from it and use it as an image. A small code snippet is given below to demonstrate image retrieval
// function to get image frame
function frameFromVideo() {
   var canvas = document.getElementById('canvas');
   var context = canvas.getContext('2d');
   return document.getElementById('smallvideo');
}
Building image from scratch
We can use image() constructor to create the image and access it using its path. The image starts loading after the image path is fed to the constructor. A small code is given below to show how an image is built from scratch using the source path.
// Create new img element
var image = new Image();
// to avoid exceptions
image.addEventListener('load', function() {
   // add draw image code statements here
}, false);
// give image source path
image.src = 'imageaddress.png';
Draw images
HTML5 Canvas element is equipped with a default method to draw images on the canvas. The method is given below
| S.No | Method & Description |
|---|---|
| 1 | drawImage() This method draws the image onto the canvas element. The method takes three types of input parameters and is given accordingly. |
| 2 | drawImage(image, x, y) This method takes the image as the first parameter and draws it at the point ( x, y) on Canvas. |
| 3 | drawImage(image, x, y, width, height) This method draws the image given as a parameter on the canvas at the point (x, y) with the given width and height. This method is generally used for scaling the image. |
| 4 | drawImage(image, sx, sy, sw, sh, dx, dy, dw, dh) This method contains source points and destination points with width and height for the source as well as the destination. This method is used for slicing the image. |
Example
Following example code implements how an image is drawn into the Canvas element.
<!DOCTYPE html>
<html lang="en">
   <head>
      <title>Images</title>
      <style>
         body {
            margin: 10px;
            padding: 10px;
         }
      </style>
   </head>
   <body onload="image();">
      <canvas id="canvas" width="450" height="200" style="border: 1px solid black;"></canvas>
      <script>
         function image() {
            var canvas = document.getElementById('canvas');
            var context = canvas.getContext('2d');
            var image = new Image();
            image.onload = function() {
               context.drawImage(image, 50, 50);
            };
            image.src = 'https://www.tutorialspoint.com/html5/images/logo.png';
         }
      </script>
   </body>
</html>
Output
The code renders the image onto canvas and is shown below
Scaling and Slicing
Image scaling is very useful when there is a need to contain the space of canvas so that other shapes or graphics can be constructed inside the Canvas element. Scaling may cause image blurriness, so the parameters should be given correctly. The method which helps us to perform scaling on the Canvas image is
drawImage( image, x, y, width, height);
Example for scaling
Following example demonstrates how scaling can be performed on the same image by varying width and height parameters . The implementation code is given below
<!DOCTYPE html>
<html lang="en">
   <head>
      <title>Images</title>
      <style>
         body {
            margin: 10px;
            padding: 10px;
         }
      </style>
   </head>
   <body onload="image();">
      <canvas id="canvas" width="600" height="400" style="border: 1px solid black;"></canvas>
      <script>
         function image() {
            var canvas = document.getElementById('canvas');
            var context = canvas.getContext('2d');
            var image = new Image();
            image.onload = function() {
               context.drawImage(image, 50, 50, 100, 75);
               context.drawImage(image, 200, 50, 50, 50);
               context.drawImage(image, 300, 50, 250, 75);
               context.drawImage(image, 50, 150, 400, 250);
            };
            image.src = 'https://www.tutorialspoint.com/html5/images/logo.png';
         }
      </script>
   </body>
</html>
Output
The output for the above code is
Slicing helps us to take a part of the image and paste it on the Canvas element. The first four parameters after the image parameter denotes the size of the image to be sliced and the other parameters denotes where it should be pasted into the Canvas with a specified width and height. The method used to achieve the slicing is
drawImage(image, sx, sy, sw, sh, dx, dy, dw, dh);
Example for slicing
Following example shows how an image is sliced. The implementation code is given below
<!DOCTYPE html>
<html lang="en">
   <head>
      <title>Images</title>
      <style>
         body {
            margin: 10px;
            padding: 10px;
         }
      </style>
   </head>
   <body onload="image();">
      <canvas id="canvas" width="300" height="150" style="border: 1px solid black;"></canvas>
      <script>
         function image() {
            var canvas = document.getElementById('canvas');
            var context = canvas.getContext('2d');
            var image = new Image();
            image.onload = function() {
               context.drawImage(image, 10, 10, 50, 50, 20, 20, 100, 100);
               context.drawImage(image, 40, 40, 50, 50, 150, 20, 100, 100);
            };
            image.src = 'https://www.tutorialspoint.com/html5/images/logo.png';
         }
      </script>
   </body>
</html>
Output
The output for the following code is
HTML Canvas - Canvas Clock
Canvas clock is mostly used to add clock features to the website. Most of the websites available today use the Canvas element to implement time-based applications on their sites as it is very easy to implement, and Canvas can make good client-side animations.
We will build a real-time analog clock in this chapter. Let us draw a basic Canvas with a circle in it so that we can make an analog clock using JavaScript. The code is given below.
<!DOCTYPE html>
<html lang="en">
   <head>
      <title>canvas clock</title>
   </head>
   <body onload="clock();">
      <canvas id="canvas" width="400" height="400" style="border: 10px solid black;background-color: burlywood;"></canvas>
      <script>
         var canvas = document.getElementById("canvas");
         var context = canvas.getContext("2d");
         var radius = canvas.height / 2;
         context.translate(radius, radius);
         radius = radius * 0.90;
         Clock();

         function Clock() {
            context.arc(0, 0, radius, 0, 2 * Math.PI);
            context.lineWidth = 15;
            context.strokeStyle = "black";
            context.stroke();
            context.fillStyle = "#dddddd";
            context.fill();
         }
      </script>
   </body>
</html>
This returns the body of canvas as
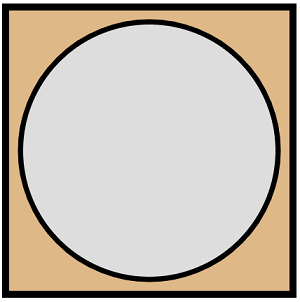
Adding a face to Canvas
We must draw a canvas first and then draw circle using arc inside the canvas where we can implement the clock. To draw the circle, we have to make sure the center of canvas is the center point of the circle which helps us to make it look better. Following code draws the Canvas element and implements clock face into it.
<!DOCTYPE html>
<html lang="en">
   <head>
      <title>canvas clock</title>
   </head>
   <body onload="clock();">
      <canvas id="canvas" width="400" height="400" style="border: 10px;"></canvas>
      <script>
         var canvas = document.getElementById("canvas");
         var context = canvas.getContext("2d");
         var radius = canvas.height / 2;
         context.translate(radius, radius);
         radius = radius * 0.90
         Clock();

         function Clock() {
            Face(context, radius);
         }

         function Face(context, radius) {
            var gradient;
            context.beginPath();
            context.arc(0, 0, radius, 0, 2 * Math.PI);
            context.fillStyle = 'white';
            context.fill();
            gradient = context.createRadialGradient(0, 0, radius * 0.95, 0, 0, radius * 1.05);
            gradient.addColorStop(0, '#555555');
            gradient.addColorStop(0.5, 'lightblue');
            gradient.addColorStop(1, '#555555');
            context.strokeStyle = gradient;
            context.lineWidth = 25;
            context.stroke();
            context.closePath();
            context.beginPath();
            context.arc(0, 0, radius * 0.1, 0, 2 * Math.PI);
            context.fillStyle = '#555555';
            context.fill();
            context.closePath()
         }
      </script>
   </body>
</html>
The output returned by the code is

Adding numbers and hands
Every clock needs numbers and hands to identify the time. So, we'll number the clock area symmetrically and draw hands as we commonly see in the real mechanical clock. The implementation code is given below.
<!DOCTYPE html>
<html lang="en">
   <head>
      <title>canvas clock</title>
   </head>
   <body onload="clock();">
      <canvas id="canvas" width="400" height="400" style="border: 10px;"></canvas>
      <script>
         var canvas = document.getElementById("canvas");
         var context = canvas.getContext("2d");
         var radius = canvas.height / 2;
         context.translate(radius, radius);
         radius = radius * 0.90;
         Clock();

         function Clock() {
            Face(context, radius);
            Numbers(context, radius);
            Time(context, radius);
         }

         function Face(context, radius) {
            var gradient;
            context.beginPath();
            context.arc(0, 0, radius, 0, 2 * Math.PI);
            context.fillStyle = 'white';
            context.fill();
            gradient = context.createRadialGradient(0, 0, radius * 0.95, 0, 0, radius * 1.05);
            gradient.addColorStop(0, '#555555');
            gradient.addColorStop(0.5, 'lightblue');
            gradient.addColorStop(1, '#555555');
            context.strokeStyle = gradient;
            context.lineWidth = 20;
            context.stroke();
            context.closePath();
            context.beginPath();
            context.arc(0, 0, radius * 0.1, 0, 2 * Math.PI);
            context.fillStyle = '#555555';
            context.fill();
            context.closePath()
         }

         function Numbers(context, radius) {
            var angle;
            var number;
            context.font = radius * 0.15 + "px Verdana";
            context.textBaseline = "middle";
            context.textAlign = "center";
            for (number = 1; number < 13; number++) {
               angle = number * Math.PI / 6;
               context.rotate(angle);
               context.translate(0, -radius * 0.85);
               context.rotate(-angle);
               context.fillText(number.toString(), 0, 0);
               context.rotate(angle);
               context.translate(0, radius * 0.85);
               context.rotate(-angle);
            }
         }

         function Time(context, radius) {
            var Present_Time = new Date();
            var hours = Present_Time.getHours();
            var minutes = Present_Time.getMinutes();
            var seconds = Present_Time.getSeconds();
            hours = hours % 12;
            hours = (hours * Math.PI / 6) + (minutes * Math.PI / (6 * 60)) + (seconds * Math.PI / (360 * 60));
            Hands(context, hours, radius * 0.5, radius * 0.07);
            minutes = (minutes * Math.PI / 30) + (seconds * Math.PI / (30 * 60));
            Hands(context, minutes, radius * 0.8, radius * 0.07);
            seconds = (seconds * Math.PI / 30);
            Hands(context, seconds, radius * 0.9, radius * 0.02);
         }

         function Hands(context, pos, length, width) {
            context.beginPath();
            context.lineWidth = width;
            context.lineCap = "round";
            context.moveTo(0, 0);
            context.rotate(pos);
            context.lineTo(0, -length);
            context.stroke();
            context.rotate(-pos);
            context.closePath();
         }
      </script>
   </body>
</html>
The clock generated after adding numbers and hands by the above code is
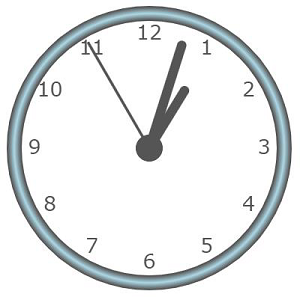
Starting the clock
Till now we have built a functioning analog clock using the Canvas element, but it does not function automatically unless we refresh the HTML page every time. Hence, we will be adding another function to make the clock autonomous so we can use it to identify the time without any error.
This makes the clock automated and works without any update of time. The code for the implementation is given below.
<!DOCTYPE html>
<html lang="en">
   <head>
      <title>canvas clock</title>
   </head>
   <body onload="clock();">
      <canvas id="canvas" width="400" height="400" style="border: 10px;"></canvas>
      <script>
         var canvas = document.getElementById("canvas");
         var context = canvas.getContext("2d");
         var radius = canvas.height / 2;
         context.translate(radius, radius);
         radius = radius * 0.90;
         setInterval(Clock, 1000);

         function Clock() {
            Face(context, radius);
            Numbers(context, radius);
            Time(context, radius);
         }

         function Face(context, radius) {
            var gradient;
            context.beginPath();
            context.arc(0, 0, radius, 0, 2 * Math.PI);
            context.fillStyle = 'white';
            context.fill();
            gradient = context.createRadialGradient(0, 0, radius * 0.95, 0, 0, radius * 1.05);
            gradient.addColorStop(0, '#555555');
            gradient.addColorStop(0.5, 'lightblue');
            gradient.addColorStop(1, '#555555');
            context.strokeStyle = gradient;
            context.lineWidth = 20;
            context.stroke();
            context.closePath();
            context.beginPath();
            context.arc(0, 0, radius * 0.1, 0, 2 * Math.PI);
            context.fillStyle = '#555555';
            context.fill();
            context.closePath()
         }

         function Numbers(context, radius) {
            var angle;
            var number;
            context.font = radius * 0.15 + "px Verdana";
            context.textBaseline = "middle";
            context.textAlign = "center";
            for (number = 1; number < 13; number++) {
               angle = number * Math.PI / 6;
               context.rotate(angle);
               context.translate(0, -radius * 0.85);
               context.rotate(-angle);
               context.fillText(number.toString(), 0, 0);
               context.rotate(angle);
               context.translate(0, radius * 0.85);
               context.rotate(-angle);
            }
         }

         function Time(context, radius) {
            var Present_Time = new Date();
            var hours = Present_Time.getHours();
            var minutes = Present_Time.getMinutes();
            var seconds = Present_Time.getSeconds();
            hours = hours % 12;
            hours = (hours * Math.PI / 6) + (minutes * Math.PI / (6 * 60)) + (seconds * Math.PI / (360 * 60));
            Hands(context, hours, radius * 0.5, radius * 0.07);
            minutes = (minutes * Math.PI / 30) + (seconds * Math.PI / (30 * 60));
            Hands(context, minutes, radius * 0.8, radius * 0.07);
            seconds = (seconds * Math.PI / 30);
            Hands(context, seconds, radius * 0.9, radius * 0.02);
         }

         function Hands(context, pos, length, width) {
            context.beginPath();
            context.lineWidth = width;
            context.lineCap = "round";
            context.moveTo(0, 0);
            context.rotate(pos);
            context.lineTo(0, -length);
            context.stroke();
            context.rotate(-pos);
            context.closePath();
         }
      </script>
   </body>
</html>
The automatic analog clock generated by the above code is
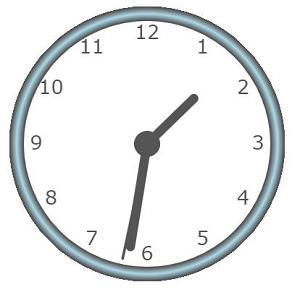
HTML Canvas - Transformations
We have learned about how the Canvas grid is used to draw shapes using the coordinates. We can use transformations to translate the position of origin to a different position, rotate and scale the grid.
Save and restore are two indispensable methods that help us to draw complex drawings. Each of the methods is described below.
| S.No | Method & Description |
|---|---|
| 1 | Save() This method is called to save the current state of the Canvas element. It saves the entire state of canvas. |
| 2 | Restore() This method rollbacks the last saved canvas state. |
Canvas uses the stack to store all the modifications done to the canvas element. The save() method can be called as many times as the user need and is pushed into the stack. Each time we call the restore() method, the last saved state is popped off the stack and is restored into the canvas.
Example
The following example illustrates how save() and restore can be implemented in the Canvas element.
<!DOCTYPE html>
<html lang="en">
   <head>
      <title>Transforming </title>
   </head>
   <body onload="transform();">
      <canvas id="canvas" width="300" height="250" style="border: 1px solid black;"></canvas>
      <script>
         function transform() {
            var canvas = document.getElementById("canvas");
            var context = canvas.getContext("2d");
            context.fillStyle = 'orange';
            context.fillRect(40, 40, 200, 150);
            context.save();
            context.fillStyle = 'white';
            context.fillRect(55, 55, 170, 120);
            context.save();
            context.fillStyle = 'green';
            context.fillRect(70, 70, 140, 90);
            context.restore();
            context.fillRect(85, 85, 110, 60);
            context.restore();
            context.fillRect(100, 100, 80, 30);
         }
      </script>
   </body>
</html>
Output
The output of the following code is
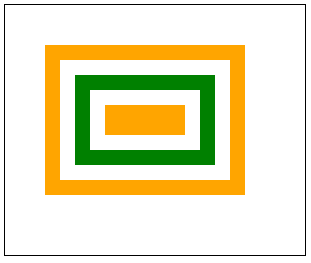
Translate
The translate() method can be used to shift the origin of the Canvas grid and draw the graphics inside. The method is given below
Translate(x, y)− The method moves the canvas origin and the grid to another position. 'x' indicates the horizontal distance to move, and 'y' indicates the vertical distance to move.
Example
The following example demonstrates the functioning of translate() method. The implementation code is given below.
<!DOCTYPE html>
<html lang="en">
   <head>
      <title>Transforming </title>
   </head>
   <body onload="translate();">
      <canvas id="canvas" width="500" height="400" style="border: 1px solid black;"></canvas>
      <script>
         function translate() {
            var canvas = document.getElementById("canvas");
            var context = canvas.getContext("2d");
            context.fillStyle = 'green';
            context.fillRect(25, 25, 150, 100);
            context.translate(100, 100);
            context.fillStyle = 'blue';
            context.fillRect(125, 125, 150, 100);
         }
      </script>
   </body>
</html>
Output
The output returned by the above code is
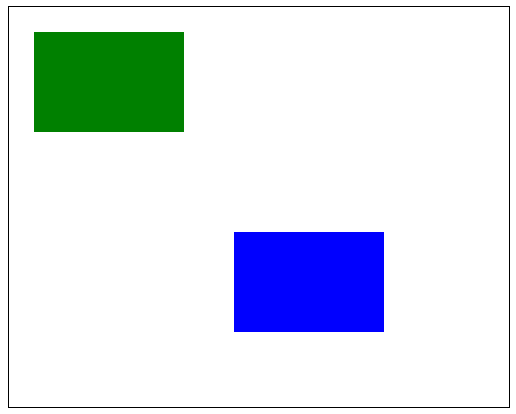
Rotate
The rotate() method can be used to rotate the Canvas element to a certain angle using origin coordinates as the point of reference. The method is given below
rotate(angle) − The canvas element is rotated at an angle passed as the parameter in the rotate() method. To change the origin position, we can use the translate() method. The angles should be given in radians.
Example
Following example demonstrates the rotate() method and shows how the angle change results the drawing shapes.
<!DOCTYPE html>
<html lang="en">
   <head>
      <title>Transforming </title>
   </head>
   <body onload="rotate();">
      <canvas id="canvas" width="350" height="250" style="border: 1px solid black;"></canvas>
      <script>
         function rotate() {
            var canvas = document.getElementById("canvas");
            var context = canvas.getContext("2d");
            context.fillStyle = 'green';
            context.fillRect(25, 25, 150, 100);
            context.translate(100, 100);
            context.rotate(75);
            context.fillStyle = 'blue';
            context.fillRect(25, 25, 150, 100);
         }
      </script>
   </body>
</html>
Output
The shapes generated by the above image are
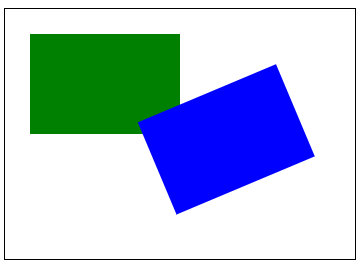
Scale and Transform
The transformation methods scaling, and transforms are mainly used to change the Canvas element grid by varying units of the canvas and transforming the positions. The methods are given below.
scale(x, y) − scale method is used to increase or decrease the size of the Canvas grid. By default, one unit of the canvas element is exactly one pixel. The scale method takes all float values and the values less than 1.0 reduce the unit size and more than 1.0 increase the unit size of Canvas which is used to scale the grid.
Example for scaling
Following example scales the canvas grid and draws a text using the available functions. The implementation code is given below
<!DOCTYPE html>
<html lang="en">
   <head>
      <title>Transforming </title>
   </head>
   <body onload="scale();">
      <canvas id="canvas" width="600" height="200" style="border: 1px solid black;"></canvas>
      <script>
         function scale() {
            var canvas = document.getElementById("canvas");
            var context = canvas.getContext("2d");
            context.scale(1.5, 3.0);
            context.font = '50px Verdana';
            context.fillText('TutorialsPoint', 10, 50);
         }
      </script>
   </body>
</html>
Output
The following code returns the canvas text as
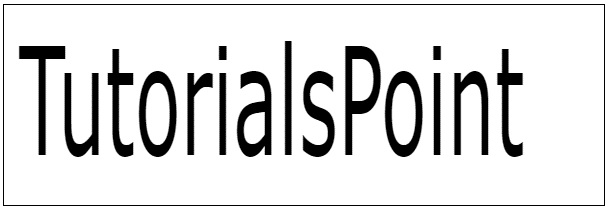
Transformation methods can be used to directly modify the transformation matrix. The methods available to achieve transforms are given below.
Transform(a, b, c, d, e, f) − This method multiplies the current matrix with the transformation matrix. The parameters involved are
a - Horizontal scaling
b - Horizontal skewing
c - Vertical skewing
d - Vertical scaling
e - Horizontal moving
f - Vertical moving
The setTransform(a, b, c, d, e, f) method: It resets the current transform to the identity matrix and calls the transform() method to set the specified transform using parameters.
The resetTransform() method − It changes the current matrix to the identity matrix.
Transform example
The following code implements transform methods on the text.
<!DOCTYPE html>
<html lang="en">
   <head>
      <title>Transforming </title>
   </head>
   <body onload="transform();">
      <canvas id="canvas" width="300" height="350" style="border: 1px solid black;"></canvas>
      <script>
         function transform() {
            var canvas = document.getElementById("canvas");
            var context = canvas.getContext("2d");
            context.font = '40px Verdana';
            context.strokeText('Transform', 50, 50);
            context.transform(0.5, 1.0, 1.5, 1.0, 0.5, 0);
            context.font = '40px Verdana';
            context.strokeText('Transform', 50, 50);
         }
      </script>
   </body>
</html>
Output
The output of the above code is
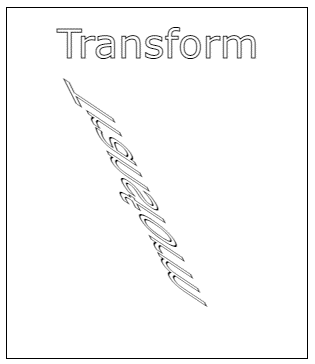
HTML Canvas - Composting and Clipping
We generally draw shapes on each other in the Canvas element when there is a need to draw more than one shape. We can use globalCompositeOperation property to order the composite shapes and there is another property clip which helps us to hide the non-required parts from the constructed shapes. The properties are mentioned below
globalCompositeOperation − By using this property, we can mask off existing shapes, draw new shapes on the existing ones, and clear sections. The values accepted by this property are mentioned in the below table.
Source-over |
Source-in |
Source-out |
Source-atop |
destination-over |
destination-in |
destination-out |
destination-atop |
lighter |
copy |
xor |
multiply |
screen |
overlay |
darken |
lighten |
color-dodge |
color-burn |
hard-light |
soft-light |
difference |
exclusion |
hue |
saturation |
color |
luminosity |
Example
The following example implements the composting properties. The code is given below
<!DOCTYPE html>
<html lang="en">
   <head>
      <meta charset="UTF-8">
      <meta http-equiv="X-UA-Compatible" content="IE=edge">
      <meta name="viewport" content="width=device-width, initial-scale=1.0">
      <title> Composting </title>
   </head>
   <body onload="composting();">
      <canvas id="canvas" width="400" height="250" style="border: 1px solid black;"></canvas>
      <script>
         function composting() {
            var canvas = document.getElementById('canvas');
            var context = canvas.getContext('2d');
            context.fillStyle = 'blue';
            context.fillRect(25, 25, 200, 200);
            context.fill();
            context.globalCompositeOperation = 'darken';
            context.fillStyle = 'purple';
            context.fillRect(125, 25, 200, 200);
            context.fill();
            context.fillStyle = 'yellow';
            context.fillRect(225, 25, 100, 200);
            context.fill();
         }
      </script>
   </body>
</html>
Output
The output returned by the above code is
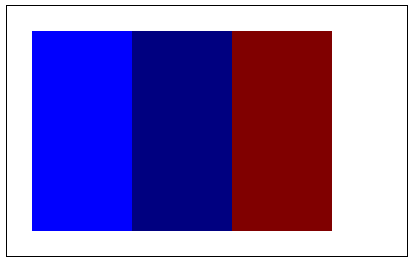
Clipping is similar to building shapes in canvas element using paths but it acts like a mask that removes unwanted parts of the obtained shape. The method used to achieve clipping is given below
Clip() − This method turns the built path shape into a clipping path. It is generally used instead of the closePath() function which turns it into a clipping path rather than stroking or filling the path.
Example for clipping
The following code implements the clipping method for the canvas element.
<!DOCTYPE html>
<html lang="en">
   <head>
      <title> Clipping </title>
   </head>
   <body onload="clipping();">
      <canvas id="canvas" width="400" height="250" style="border: 1px solid black;"></canvas>
      <script>
         function clipping() {
            var canvas = document.getElementById('canvas');
            var context = canvas.getContext('2d');
            context.fillStyle = 'skyblue';
            context.fillRect(0, 0, 400, 250);
            context.fill();
            context.beginPath();
            context.arc(200, 125, 100, 1 * Math.PI, 5 * Math.PI);
            context.fillStyle = 'orange';
            context.fill();
            context.clip();
         }
      </script>
   </body>
</html>
Output
The output for the above code formed is shown below −
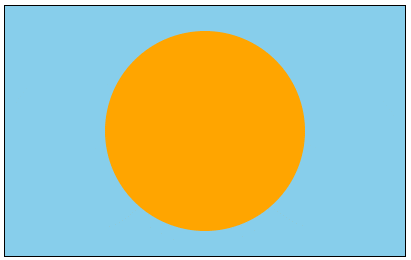
HTML Canvas - Basic Animations
The canvas element completely uses JavaScript to draw shapes and add styles to them. The same JavaScript can be used to make very attractive animations on the Canvas element. Since animations are dynamic, the objects inside the Canvas element take some time to render.
Controlling the Animation
Canvas element shapes are generally constructed using methods or custom functions. Hence, we cannot add animation to them unless they are rendered correctly on the canvas element. Since animations change the nature of the canvas, scheduled updating must be a compulsory operation. There are some animation methods used to control the functionality of the animations on the Canvas element. Each of the methods is described below
| S.No | Method & Description |
|---|---|
| 1 | setInterval(callback_function, time) This method is used to repeat a given task in each timeframe. It takes a function which contains the required task and time in milliseconds as its parameters. |
| 2 | setTimeout(callback_function, time) When a task should be done once for a certain period, this method is used. It takes the executable function and time in milliseconds as its parameters. |
| 3 | requestAnimationFrame(callback_function) This method updates the browser to perform an animation request before the next animation or update. |
These animation methods are generally used in the Canvas element to develop 2D games and interactive UI designs.
Steps to add basic animations
To add animations to the Canvas element, there are some steps to be followed which are listed below
Step 1 − Clear the complete Canvas element − To add any animations to the Canvas element, there must be no drawings inside which do not fill the complete canvas space. This can be done by calling the clearRect() method.
Step 2 − Save the default Canvas state − Since we apply various styles and add different settings such as transformations, slicing, etc, we have to save the main canvas state to make sure we can roll back to the main state when needed. Save() function is used to achieve this.
Step 3 − Draw the shapes with added animations − We render the drawn shapes with different animations available. This is the first step where animations are applied to the Canvas element.
Step 4 − Restore the Canvas element when needed − Since we have already saved the canvas states using the save() method, we can restore them before drawing a new frame using the restore() function.
Example 1
The following program demonstrates how clearRect() method works and how to use it to perform animations.
<!DOCTYPE html>
<html lang="en">
   <head>
      <title>Animations</title>
      <style>
         #button {
            position: absolute;
            top: 350px;
            left: 150px;
         }
      </style>
   </head>
   <body onload="animation();">
      <canvas id="canvas" width="600" height="400" style="border: 1px solid black;"></canvas>
      <script>
         function animation() {
            var canvas = document.getElementById("canvas");
            var context = canvas.getContext("2d");
            context.fillStyle = 'purple';
            context.fillRect(75, 75, 300, 150);
            context.font = '25px Verdana';
            context.fillText('To remove text and rect, press the button', 10, 300);
            document.getElementById('clear').addEventListener('click', function() {
               context.clearRect(0, 0, canvas.width, canvas.height);
            }, false);
         }
      </script>
      <div id="button">
         <input type="button" id="clear" value="Clear the whole Canvas element">
      </div>
   </body>
</html>
Output
The output returned by the above program is given below
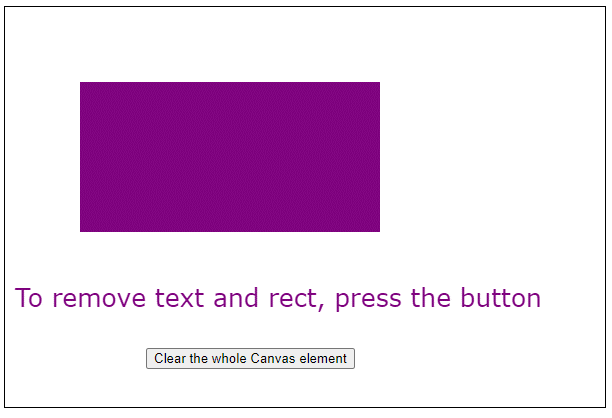
If you press the button, the canvas changes to the image shown below
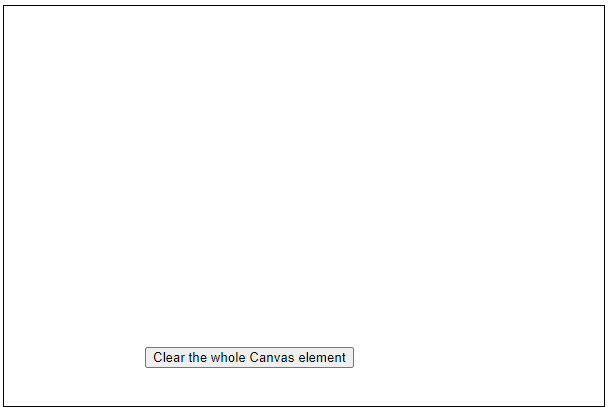
To see the text and shape again, refresh the page.
Example 2
The following code shows how simple animations can be performed to the Canvas element.
<!DOCTYPE html>
<html lang="en">
   <head>
      <title>Animations</title>
      <style>
         body {
            margin: 10px;
            padding: 10px;
         }
      </style>
   </head>
   <body onload="animate();">
      <canvas id="canvas" width="600" height="200" style="border: 1px solid black;"></canvas>
      <script>
         function animate() {
            window.requestAnimFrame = (function(callback) {
               return window.requestAnimationFrame || window.webkitRequestAnimationFrame || window.mozRequestAnimationFrame || window.oRequestAnimationFrame || window.msRequestAnimationFrame || function(callback) {
                  window.setTimeout(callback, 1000);
               };
            })();

            function drawShapes(square, context) {
               context.beginPath();
               context.rect(square.x, square.y, square.width, square.height);
               context.fillStyle = 'green';
               context.fill();
               context.lineWidth = square.borderWidth;
               context.strokeStyle = 'black';
               context.stroke();
               context.closePath();
               context.font = '50px Verdana';
               context.fillStyle = 'white';
               context.fillText('Hi', square.x + 15, square.height + 40);
            }

            function animation(square, canvas, context, startTime) {
               // updating the time and speed of movement parameters
               var time = (new Date()).getTime() - startTime;
               var speed = 100;
               var X = speed * time / 1000;
               if (X < canvas.width - square.width - square.borderWidth / 2) {
                  square.x = X;
               }
               // clearing the Canvas element space
               context.clearRect(0, 0, canvas.width, canvas.height);
               drawShapes(square, context);
               // requesting new frame for animation
               requestAnimFrame(function() {
                  animation(square, canvas, context, startTime);
               });
            }
            var canvas = document.getElementById('canvas');
            var context = canvas.getContext('2d');
            var square = {
               x: 0,
               y: 75,
               width: 100,
               height: 100,
               borderWidth: 3
            };
            drawShapes(square, context);
            // buffer time before starting animation
            setTimeout(function() {
               var startTime = (new Date()).getTime();
               animation(square, canvas, context, startTime);
            }, 1000);
         }
      </script>
   </body>
</html>
Output
The animated output returned by the above code is
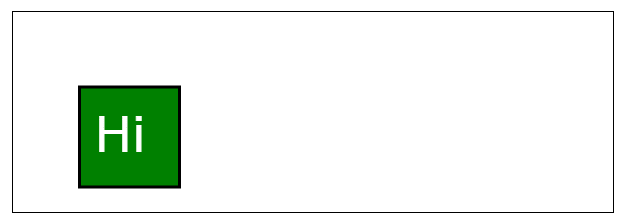
After the animation, the position of the square is changed as shown below
Example 3
The following code demonstrates a simple looping of TutorialsPoint logo in the Canvas element frame.
<!DOCTYPE html>
<html lang="en">
   <head>
      <title>Animations</title>
      <style>
         body {
            margin: 10px;
            padding: 10px;
         }
      </style>
   </head>
   <body onload="animate()">
      <canvas id="context" width="350" height="120" style="border: 1px solid black;background-color: brown;"></canvas>
      <script>
         function animate() {
            var image = new Image();
            image.src = 'https://www.tutorialspoint.com/themes/home/tp-diamond-logo-white.png';
            var X = 600;
            var Y = 150;
            var velocity = 30;
            var scale = 1.05;
            var y = -4.5;
            var disx = 0.75;
            var imgwidth;
            var imgheight;
            var x = 0;
            var RemoveX;
            var RemoveY;
            var context;
            image.onload = function() {
               imgwidth = image.width * scale;
               imgheight = image.height * scale;
               if (imgwidth > X) {
                  x = X - imgwidth;
               }
               if (imgwidth > X) {
                  RemoveX = imgwidth;
               } else {
                  RemoveX = X;
               }
               if (imgheight > Y) {
                  RemoveY = imgheight;
               } else {
                  RemoveY = Y;
               }
               var canvas = document.getElementById('context')
               context = canvas.getContext('2d');
               return setInterval(draw, velocity);
            }

            function draw() {
               context.clearRect(0, 0, RemoveX, RemoveY);
               if (imgwidth <= X) {
                  if (x > X) {
                     x = -imgwidth + x;
                  }
                  if (x > 0) {
                     context.drawImage(image, -imgwidth + x, y, imgwidth, imgheight);
                  }
                  if (x - imgwidth > 0) {
                     context.drawImage(image, -imgwidth * 2 + x, y, imgwidth, imgheight);
                  }
               } else {
                  if (x > (X)) {
                     x = X - imgwidth;
                  }
                  if (x > (X - imgwidth)) {
                     context.drawImage(image, x - imgwidth + 1, y, imgwidth, imgheight);
                  }
               }
               context.drawImage(image, x, y, imgwidth, imgheight);
               x += disx;
            }
         }
      </script>
   </body>
</html>
Output
The code returns loop output as shown below

HTML Canvas - Advanced Animations
In the previous chapter, Basic animations help us to understand how to animate the Canvas element. Here, we will be looking at the physical concepts of animation such as velocity, acceleration, etc.
Let us work on a simple acceleration example where we use a small square to expand and collapse. The implementation code is given below.
Example
<!DOCTYPE html>
<html lang="en">
   <head>
      <title>Advanced Animations</title>
      <style>
         body {
            margin: 10px;
            padding: 10px;
         }
      </style>
   </head>
   <body onload="animation();">
      <canvas id="canvas" width="555" height="555" style="border: 1px solid black;"></canvas>
      <script>
         function animation() {
            var canvas = document.getElementById('canvas');
            var context = canvas.getContext('2d');
            var reqframe;
            var square = {
               posx: 0,
               posy: 0,
               width: 50,
               height: 50,
               vx: 2,
               vy: 1,
               draw: function() {
                  context.fillRect(this.posx, this.posy, this.width, this.height);
                  context.fillStyle = 'red';
                  context.fill();
               }
            };

            function draw() {
               context.clearRect(0, 0, canvas.width, canvas.height);
               square.draw();
               square.width += square.vx;
               square.height += square.vy;
               if (square.height + square.vy > canvas.height || square.height + square.vy < 0) {
                  square.vy = -square.vy;
               }
               if (square.width + square.vx > canvas.width || square.width + square.vx < 0) {
                  square.vx = -square.vx;
               }
               reqframe = window.requestAnimationFrame(draw);
            }
            canvas.addEventListener('mouseover', function(e) {
               reqframe = window.requestAnimationFrame(draw);
            });
            canvas.addEventListener('mouseout', function(e) {
               window.cancelAnimationFrame(reqframe);
            });
         }
      </script>
   </body>
</html>
Output
The output returned by the code is
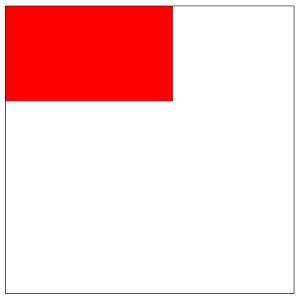
HTML Canvas - Element
Canvas element is the outline of the HTML Canvas tag which is defined by the HTML code and is styled using the CSS. We can render graphics inside the canvas using JavaScript code by a context object.
Canvas element is equipped with the interface HTMLCanvasElement containing properties and methods to manipulate the layout as well as the features supported by the Canvas element.
The properties and methods available to create and modify the Canvas element are given in the below table.
Properties
Following are various properties of HTML Canvas Element −
| S.No | Property and Description |
|---|---|
| 1 | Canvas
The canvas property of CanvasRenderingContext2D interface provides the canvas outline by using CSS styling. Without styling, we cannot see it on the webpage even though it is formed. |
| 2 | Width
This property helps us to set the width for the Canvas layout. |
| 3 | Height
This property helps us to set the height for the Canvas layout. |
Methods
Below given is the list of methods provided by the HTML Canvas Element class −
| S.No | Method & Description |
|---|---|
| 1 | getContext()
This method refers to the context of the drawing on the Canvas element. We give the context type and attributes as the parameters which are displayed on the Canvas. |
HTML Canvas - Rectangles
Rectangle is a simple 2D shape consisting of 4 sides, corners and right angles. Opposite sides of the rectangle have same length and one pair is bigger than the other.
The interface CanvasRenderringContext2D provides properties and methods to render 2D graphics such as rectangles onto the drawing surface of Canvas element. It can be used for drawing shapes as well as styling them on the <canvas> element.
Properties
The properties available to draw rectangles inside the Canvas element are given in the below table.
| S.No | Property and Description |
|---|---|
| 1 | fillStyle
This property can be used to fill the shape drawn onto canvas and specifies the color, gradient or pattern used. The input of this property is all coloring values. |
| 2 | strokeStyle
This property applies color, gradient or pattern to the stroked shapes inside Canvas element. |
Methods
Following are the various methods available to draw various shapes on HTML Canvas −
| S.No | Method & Description |
|---|---|
| 1 | clearRect()
This method erases all the pixels in the given rectangular area by parameters. |
| 2 | fillRect()
This method draws a filled rectangle with the given dimensions inside Canvas element. |
| 3 | getContextAttributes()
This method creates an object containing context parameters of the available canvas. To fetch and display this data, we use console or window alerts. |
| 4 | rect()
The constructor method rect() is used to add rectangle to the current path. |
| 5 | strokeRect()
This method draws a stroked rectangle with the given dimensions inside Canvas element. |
HTML Canvas - Lines
Line is a simple figure formed by a set of points which are extended in opposite direction towards one another until they meet.
The interface CanvasRenderringContext2D contains properties and methods to draw lines onto the canvas element using the context object of interface. The interface can be used for drawing lines as well as styling them on the <canvas> element.
Properties
The properties and available to draw and style lines inside the Canvas element are given in the below table.
| S.No | Property and Description |
|---|---|
| 1 | lineCap
The property lineCap helps us to style the ends of the lines drawn using lineTo() method. |
| 2 | lineDashOffset
This property helps us to draw dashed lines onto the Canvas. |
| 3 | lineJoin
This property allows to style the point where the endpoints of two line segments meet. |
| 4 | lineWidth
This property of the Canvas API can be used to change the thickness of the lines drawn on the Canvas element. |
| 5 | miterLimit
The property miterLimit of the CanvasRenderingContext2D interface helps us to set the ratio of miter limit. |
Methods
Following are the list of methods available to draw various types lines using HTML Canvas −
| S.No | Method & Description |
|---|---|
| 1 | getLineDash()
The method getLineDash() of Canvas API returns a line dash pattern. |
| 2 | lineTo()
This method draws a line from its current point to the point given as the parameters. |
| 3 | setLineDash()
This method can be used to set the line dash pattern while adding strokes to the lines in a Canvas element. |
HTML Canvas - Paths
Path is a continuous mapping of points as a trial which does not have repeating vertices and does can go in any angle until the final destination point is reached.
The interface CanvasRenderringContext2D and Path2D contains properties and methods to add paths onto the canvas element using the context object of interface. The interface can be used for adding paths as well as closing them on the <canvas> element.
The properties and methods available to add paths and draw shapes inside the Canvas element are given in the below table.
| S.No | Method & Description | |
|---|---|---|
| 1 | addPath()
This method can be used to add an extra path for the current path. |
|
| 2 | arc()
The arc() method of Canvas API can be used to draw circular arcs to the path started. |
|
| 3 | arcTo()
The arcTo() method of Canvas API can be used to draw circular arcs to current path with given control points and radius as parameters. |
|
| 4 | beginPath()
When we have to draw graphics on Canvas element using paths, we call this method to create a new path. |
|
| 5 | bezierCurveTo()
The method bezierCurveTo() of CanvasRenderingContext2D interface draws |
|
| 6 | clip()
This method is used to clip a region of path and draw another graphics in it. | |
| 7 | closePath()
The method closePath() closes the current path by doing the required operations. |
|
| 8 | drawFocusIfNeeded()
To add focus to an existing path or a path that is about to be created, this method can be called by the interface. |
|
| 9 | ellipse()
This method is used to draw an elliptical arc on the drawing surface of Canvas element. | |
| 10 | fill()
This method fills the current or given path with black by default unless fillStyle property is given. |
|
| 11 | isPointInPath()
To check whether a point is inside or with the path, we use this method. It takes the point as parameter and returns Boolean value. | |
| 12 | isPointInStroke()
This method of Canvas 2D API verifies whether the given point is inside a stroked path or not and returns Boolean value (true or false). |
|
| 13 | moveTo()
The context object moves the sub path to the given co-ordinates by parameters. |
|
| 14 | Path2D()
This constructor method creates a Path2D object from which all the shapes can be invoked and drawn onto the Canvas element. |
|
| 15 | quadraticCurveTo()
This method draws a quadratic Bezier curve by using the path context. |
|
| 16 | scrollPathIntoView()
This method of Canvas 2D API when called, scrolls the available path into view when it is passed as the parameter. |
|
| 17 | stroke()
This method of Canvas API adds strokes to the current path or shape which is drawn inside the Canvas element. |
HTML Canvas - Text
Text can be rendered on the Canvas element using the available methods and properties. We can also style the drawn text so that efficient graphics can be generated.
The TextMetrics interface and CanvasRenderingcontext2D is used to draw and style text as well as to identify the structural properties of text rendered inside the Canvas element. The text is generally rendered using a CanvasRenderingContext2D object by available methods and also can be retrieved using read-only properties.
Properties
The properties available to draw and style text on the Canvas element are listed in the below table.
| S.No | Property and Description |
|---|---|
| 1 | actualBoundingBoxAscent
This property returns the distance from the horizontal line indicated by the baseline property to the rectangle top from which text is drawn inside the Canvas. |
| 2 | actualBoundingBoxDescent
This property returns the distance from the horizontal line indicated by the baseline property to the rectangle bottom from which text is drawn inside the Canvas. |
| 3 | actualBoundingBoxLeft
This property returns the distance parallel to the text baseline to the left side of bounding rectangle of text in pixels. |
| 4 | actualBoundingBoxRight
This property returns the distance parallel to the text baseline to the right side of bounding rectangle of text in pixels. |
| 5 | direction
The direction property specifies the direction of text which is about to be drawn onto the Canvas element. |
| 6 | font
This property of Canvas API specifies the text size, style and font style of the text about to be drawn onto the Canvas element. |
| 7 | fontBoundingBoxAscent
This property of the TextMetrics interface returns the distance from horizontal line of text baseline to the top of highest bounding rectangle of the text inside canvas element. |
| 8 | fontBoundingBoxDescent
This property of the TextMetrics interface returns the distance from horizontal line of text baseline to the bottom of highest bounding rectangle of the text inside canvas element. |
| 9 | textAlign
This property of Canvas element object specifies the text alignment to be used when drawing text. |
| 10 | textBaseline
This property of Canvas element object specifies the text baseline to be used when drawing text. |
Methods
Following are various methods available to perform various operations on the Text element of HTML Canvas.
| S.No | Method & Description |
|---|---|
| 1 | fillText()
This method fills the text drawn on the Canvas element. |
| 2 | MeasureText()
when this method is used, the text information which is drawn onto the canvas is returned. |
| 3 | strokeText()
This method adds strokes to the text to be drawn on the Canvas element. |
HTML Canvas - Colors and Styles
We can also style the drawn graphics onto Canvas using its API methods and properties so that attractive visual content can be generated and used. Canvas provides a wide variety of options to style the graphics rendered on the Canvas element.
The interface CanvasRenderringContext2D contains most of the methods and properties to create attractive graphics on the Canvas element. The other interfaces containing graphic styling methods and properties are also used by the context object when needed.
Properties
Following is the list of properties available to apply different Colors and Styles to HTML5 elements.
| S.No | Property & Description |
|---|---|
| 1 | filter
This property provides filter effects such as grayscale, opacity, and blurring. It accepts all the values accepted by CSS filter style. |
2 | globalAlpha
This property specifies the transparency to be applied to the current graphic of the Context object. |
| 3 | globalCompositeOperation
This property applies the compositing operations to the Canvas element object. |
Methods
The methods available to create graphics as well as to color and style them inside the Canvas element are given in the below table.
| S.No | Method & Description | |
|---|---|---|
| 1 | addcolorStop()
This method adds a new color stop given to the canvas gradient inside the canvas element. |
|
| 2 | createConicGradient()
The method createConicGradient() of Canvas API creates a gradient around a point with given co-ordinates. |
|
| 3 | createLinearGradient()
The method createLinearGradient() of Canvas API creates a gradient along the line connecting given co-ordinates. | |
| 4 | createPattern()
This method creates a pattern by repetition of the input image in the given area. |
|
| 5 | createRadialGradient()
The method createRadialGradient() of Canvas API creates a radial gradient by using size and given co-ordinates of two circles. |
HTML Canvas - Images
Images are very important and primary requirement to generate attractive visual content. Canvas API has a wide variety of image manipulation features to take an input image as well as to manipulate them based on the requirement.
The interfaces CanvasRenderringContext2D and ImageData contains all the methods and properties to create attractive graphics using images on the Canvas element.
Properties
Following are the various properties available in HTML5 to deal with images −
| S.No | Property & Description |
|---|---|
| 1 | data
This data property returns the pixel data of ImageData object. |
| 2 | imageSmoothingEnabled
This property of the Canvas API determines whether the scaled images available are smoothed or not. It returns true if image is scaled and false if it is not scaled. |
| 3 | imageSmoothingQuality
This property of the Canvas API lets us to set the quality of the image smoothing for an image drawn on Canvas. |
Methods
The methods available to create graphics based on images inside the Canvas element are given in the below table.
| S.No | Method & Description |
|---|---|
| 1 | createImageData()
This method can be used to create a new ImageData object with given dimensions. The object formed is filled with black pixels unless changed. |
| 2 | drawImage()
This method draws the image onto the Canvas element. |
| 3 | getImageData()
The method getImageData() captures the image frame for the given co-ordinates passed as the parameters. The captured image is printed in the canvas element at given point. |
| 4 | ImageData()
This constructor method returns newly created Image data object with the data passed as parameters. |
| 5 | putImageData()
This method paints the data given by ImageData object onto the Canvas element. We can retrieve this data using getImageData() method. |
HTML Canvas - Shadows and Transformations
Canvas API also consists of some advanced graphic styling features which can be used to improve the appearance of the rendered graphics onto the Canvas element. Shadows and Transformations can be applied to the canvas context object by using the available methods and properties.
The interface CanvasRenderringContext2D contains almost all the methods and properties to create attractive graphics using shadows and transformations inside the Canvas element.
Properties
Following are various properties related to shadows and transformations available in HTML5.
| S.No | Property & Description |
|---|---|
| 1 | shadowBlur
This property of the Canvas API applies blurred shadows to the Context object drawn inside canvas element. |
| 2 | shadowColor
The property shadowColor specifies the color to be applied to the Context object shadow drawn inside the Canvas element. |
| 3 | shadowOffsetX
We can set the horizontal shadow distance to be drawn for the context object using shadowOffsetX property. |
| 4 | shadowOffsetY
We can set the vertical shadow distance to be drawn for the context object using shadowOffsetY property. |
Methods
The methods available to create graphics with shadows and transformations inside the Canvas element are given in the below table.
| S.No | Method & Description |
|---|---|
| 1 | getTransform() This method of CanvasRenderringContext2D interface retrieves the transforms applied to the current canvas element context. |
| 2 | resetTransform()
This method resets the current transform into the identity matrix by transferring the current graphics into original shape or path inside the Canvas element. |
| 3 | restore()
This method restores the most recently saved canvas state when called. |
| 4 | rotate()
This method of Canvas API adds rotation to the transformation matrix of the context object. |
| 5 | save()
This method saves the most recent canvas state when called by pushing it into the stack. |
| 6 | scale()
This method scales the current context object horizontally/vertically when called. |
| 7 | setTransform()
This method of the Canvas 2D API invokes a transformation matrix for the given shape and helps us to perform movement operations such as rotate, translate, and scale. |
| 8 | transform()
This method changes the transformation matrix which allows us to scale, rotate, skew the context object. |
| 9 | translate()
This method of the Canvas API adds the translation transformation to the current matrix. |
