- MATLAB - Home
- MATLAB - Overview
- MATLAB - Features
- MATLAB - Environment Setup
- MATLAB - Editors
- MATLAB - Online
- MATLAB - Workspace
- MATLAB - Syntax
- MATLAB - Variables
- MATLAB - Commands
- MATLAB - Data Types
- MATLAB - Operators
- MATLAB - Dates and Time
- MATLAB - Numbers
- MATLAB - Random Numbers
- MATLAB - Strings and Characters
- MATLAB - Text Formatting
- MATLAB - Timetables
- MATLAB - M-Files
- MATLAB - Colon Notation
- MATLAB - Data Import
- MATLAB - Data Output
- MATLAB - Normalize Data
- MATLAB - Predefined Variables
- MATLAB - Decision Making
- MATLAB - Decisions
- MATLAB - If End Statement
- MATLAB - If Else Statement
- MATLAB - If…Elseif Else Statement
- MATLAB - Nest If Statememt
- MATLAB - Switch Statement
- MATLAB - Nested Switch
- MATLAB - Loops
- MATLAB - Loops
- MATLAB - For Loop
- MATLAB - While Loop
- MATLAB - Nested Loops
- MATLAB - Break Statement
- MATLAB - Continue Statement
- MATLAB - End Statement
- MATLAB - Arrays
- MATLAB - Arrays
- MATLAB - Vectors
- MATLAB - Transpose Operator
- MATLAB - Array Indexing
- MATLAB - Multi-Dimensional Array
- MATLAB - Compatible Arrays
- MATLAB - Categorical Arrays
- MATLAB - Cell Arrays
- MATLAB - Matrix
- MATLAB - Sparse Matrix
- MATLAB - Tables
- MATLAB - Structures
- MATLAB - Array Multiplication
- MATLAB - Array Division
- MATLAB - Array Functions
- MATLAB - Functions
- MATLAB - Functions
- MATLAB - Function Arguments
- MATLAB - Anonymous Functions
- MATLAB - Nested Functions
- MATLAB - Return Statement
- MATLAB - Void Function
- MATLAB - Local Functions
- MATLAB - Global Variables
- MATLAB - Function Handles
- MATLAB - Filter Function
- MATLAB - Factorial
- MATLAB - Private Functions
- MATLAB - Sub-functions
- MATLAB - Recursive Functions
- MATLAB - Function Precedence Order
- MATLAB - Map Function
- MATLAB - Mean Function
- MATLAB - End Function
- MATLAB - Error Handling
- MATLAB - Error Handling
- MATLAB - Try...Catch statement
- MATLAB - Debugging
- MATLAB - Plotting
- MATLAB - Plotting
- MATLAB - Plot Arrays
- MATLAB - Plot Vectors
- MATLAB - Bar Graph
- MATLAB - Histograms
- MATLAB - Graphics
- MATLAB - 2D Line Plot
- MATLAB - 3D Plots
- MATLAB - Formatting a Plot
- MATLAB - Logarithmic Axes Plots
- MATLAB - Plotting Error Bars
- MATLAB - Plot a 3D Contour
- MATLAB - Polar Plots
- MATLAB - Scatter Plots
- MATLAB - Plot Expression or Function
- MATLAB - Draw Rectangle
- MATLAB - Plot Spectrogram
- MATLAB - Plot Mesh Surface
- MATLAB - Plot Sine Wave
- MATLAB - Interpolation
- MATLAB - Interpolation
- MATLAB - Linear Interpolation
- MATLAB - 2D Array Interpolation
- MATLAB - 3D Array Interpolation
- MATLAB - Polynomials
- MATLAB - Polynomials
- MATLAB - Polynomial Addition
- MATLAB - Polynomial Multiplication
- MATLAB - Polynomial Division
- MATLAB - Derivatives of Polynomials
- MATLAB - Transformation
- MATLAB - Transforms
- MATLAB - Laplace Transform
- MATLAB - Laplacian Filter
- MATLAB - Laplacian of Gaussian Filter
- MATLAB - Inverse Fourier transform
- MATLAB - Fourier Transform
- MATLAB - Fast Fourier Transform
- MATLAB - 2-D Inverse Cosine Transform
- MATLAB - Add Legend to Axes
- MATLAB - Object Oriented
- MATLAB - Object Oriented Programming
- MATLAB - Classes and Object
- MATLAB - Functions Overloading
- MATLAB - Operator Overloading
- MATLAB - User-Defined Classes
- MATLAB - Copy Objects
- MATLAB - Algebra
- MATLAB - Linear Algebra
- MATLAB - Gauss Elimination
- MATLAB - Gauss-Jordan Elimination
- MATLAB - Reduced Row Echelon Form
- MATLAB - Eigenvalues and Eigenvectors
- MATLAB - Integration
- MATLAB - Integration
- MATLAB - Double Integral
- MATLAB - Trapezoidal Rule
- MATLAB - Simpson's Rule
- MATLAB - Miscellenous
- MATLAB - Calculus
- MATLAB - Differential
- MATLAB - Inverse of Matrix
- MATLAB - GNU Octave
- MATLAB - Simulink
MATLAB - Plotting Error Bars
Error bars provide a visual representation of the uncertainty or variability associated with data points in a plot. They are particularly useful in scientific and statistical analysis to communicate the reliability of the data. The length of an error bar typically represents a measure of dispersion, such as standard deviation or confidence intervals, around each data point.
Matlab provides an errorbar() method that helps to plot error bar graphs. Let us dive into more details about it.
MATLAB's Error Bars Function
The errorbar function in MATLAB is specifically designed for creating plots with error bars.
Syntax
errorbar(y,err)
errorbar(x,y,err)
errorbar(x,y,neg,pos)
errorbar(___,ornt)
errorbar(x,y,yneg,ypos,xneg,xpos)
errorbar(___,LineSpec)
errorbar(___,Name,Value)
errorbar(ax,___)
e = errorbar(___)
Let us understand the explanation of each syntax in detail −
errorbar(y,err) − Generates a line plot of the data in y and includes vertical error bars at each data point. The lengths of the error bars, both above and below the data points, are determined by the values in err. Therefore, the overall length of each error bar is twice the corresponding value in err.
errorbar(x,y,err) − Creates a plot where y is plotted against x, and a vertical error bar is displayed at each data point.
errorbar(x,y,neg,pos) − Illustrates a vertical error bar at each data point, with neg determining the length below the data point and pos determining the length above the data point.
errorbar(___,ornt) − Configures the orientation of the error bars. Specify ornt as "horizontal" for horizontal error bars or "both" for both horizontal and vertical error bars. The default setting for ornt is "vertical," which results in the drawing of vertical error bars. Integrate this option after any of the preceding input argument combinations.
errorbar(x,y,yneg,ypos,xneg,xpos) − Generates a plot of y versus x and includes both horizontal and vertical error bars. The lengths of the vertical error bars are determined by yneg (lower) and ypos (upper), while the lengths of the horizontal error bars are determined by xneg (left) and xpos (right).
errorbar(___,LineSpec) − Configures the line style, marker symbol, and color for the plot. For instance, using "--ro" results in a dashed, red line with circle markers. It's important to note that the line style exclusively impacts the line and not the error bars.
errorbar(___,Name,Value) − Adjusts the visual aspects of the line and error bars by employing one or more name-value pair arguments. For instance, specifying "CapSize", 10 establishes the lengths of the caps at the end of each error bar to be 10 points.
errorbar(ax,___) − Generates the plot within the axes indicated by ax instead of the current axes. Designate the axes as the initial input argument.
e = errorbar(___) − Provides an ErrorBar object for each plotted line. Utilize e to adjust properties of a particular ErrorBar object once it has been created.
Let us now see examples for each of the syntax we have explained above.
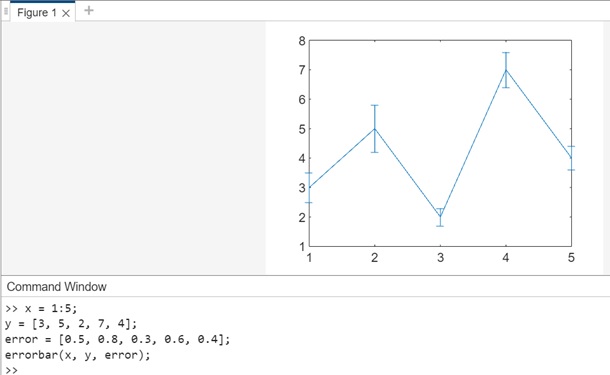
Example 1: Using errorbar(x,y,err)
x = 1:5;
y = [3, 5, 2, 7, 4];
error = [0.5, 0.8, 0.3, 0.6, 0.4];
errorbar(x, y, error);
In the example above −
- x − Represents the x-coordinates of the data points.
- y − Corresponds to the y-coordinates of the data points.
- error − Specifies the error values associated with each data point.
The method, errorbar(x, y, error) creates a line plot of the data in y with vertical error bars at each data point.The lengths of the error bars, both above and below the data points, are determined by the values in the error vector.
The code when executed in matlab command window the output is −
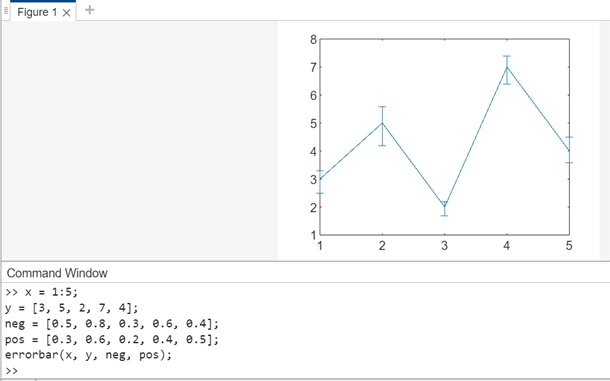
Example 2: Using errorbar(x,y,neg,pos)
The code for the above syntax is as follows −
x = 1:5;
y = [3, 5, 2, 7, 4];
neg = [0.5, 0.8, 0.3, 0.6, 0.4];
pos = [0.3, 0.6, 0.2, 0.4, 0.5];
errorbar(x, y, neg, pos);
In the example −
- x − Represents the x-coordinates of the data points.
- y − Corresponds to the y-coordinates of the data points.
- neg − Specifies the lengths of the error bars below each data point.
- pos − Specifies the lengths of the error bars above each data point.
In this example, errorbar(x, y, neg, pos) generates a plot where a vertical error bar is illustrated at each data point. The lengths of the error bars below the data points are determined by the values in the neg vector, and the lengths above the data points are determined by the values in the pos vector.
The code when executed in matlab command window the output is −
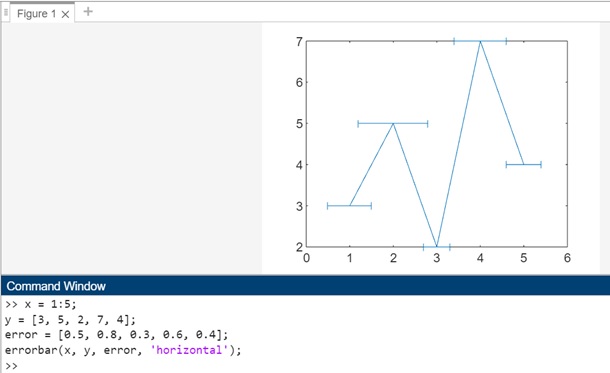
Example 3: Using errorbar(___,ornt)
The code for above syntax is −
x = 1:5;
y = [3, 5, 2, 7, 4];
error = [0.5, 0.8, 0.3, 0.6, 0.4];
errorbar(x, y, error, 'horizontal');
In the example above −
- x − Represents the x-coordinates of the data points.
- y − Corresponds to the y-coordinates of the data points.
- error − Specifies the error values associated with each data point.
In this example, errorbar(x, y, error, 'horizontal') configures the orientation of the error bars to be horizontal. The default setting for ornt is "vertical," resulting in vertical error bars. By specifying 'horizontal' as the ornt value, the plot now includes horizontal error bars.
When you execute the code in matlab command window the output is −
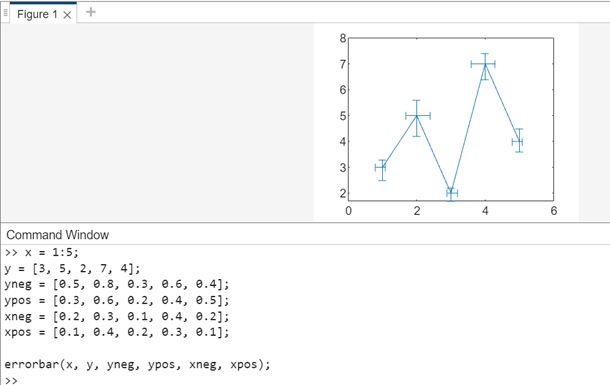
Example 4: Using errorbar(x,y,yneg,ypos,xneg,xpos)
The code for above syntax is −
x = 1:5;
y = [3, 5, 2, 7, 4];
yneg = [0.5, 0.8, 0.3, 0.6, 0.4];
ypos = [0.3, 0.6, 0.2, 0.4, 0.5];
xneg = [0.2, 0.3, 0.1, 0.4, 0.2];
xpos = [0.1, 0.4, 0.2, 0.3, 0.1];

errorbar(x, y, yneg, ypos, xneg, xpos);
In above example −
- x − Represents the x-coordinates of the data points.
- y − Corresponds to the y-coordinates of the data points.
- yneg − Specifies the lengths of the lower vertical error bars.
- ypos − Specifies the lengths of the upper vertical error bars.
- xneg − Specifies the lengths of the left horizontal error bars.
- xpos − Specifies the lengths of the right horizontal error bars.
The method, errorbar(x, y, yneg, ypos, xneg, xpos) generates a plot where both horizontal and vertical error bars are included. The lengths of the vertical error bars are determined by the yneg (lower) and ypos (upper) vectors, while the lengths of the horizontal error bars are determined by the xneg (left) and xpos (right) vectors.
When you execute the code inside matlab command window the output is −
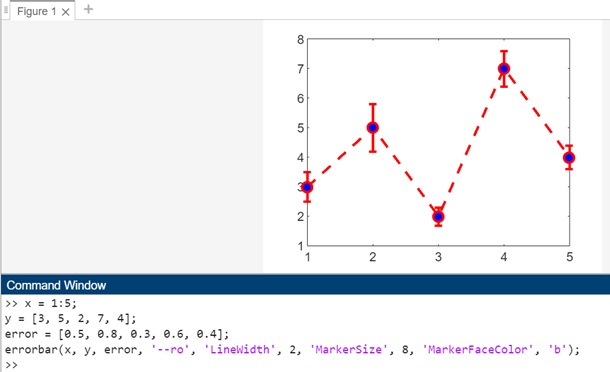
Example 5: Using errorbar(___,LineSpec)
The code for above syntax is −
x = 1:5;
y = [3, 5, 2, 7, 4];
error = [0.5, 0.8, 0.3, 0.6, 0.4];
errorbar(x, y, error, '--ro', 'LineWidth', 2, 'MarkerSize', 8, 'MarkerFaceColor', 'b');
In this example −
- x − Represents the x-coordinates of the data points.
- y − Corresponds to the y-coordinates of the data points.
- error − Specifies the error values associated with each data point.
The method errorbar(x, y, error, '--ro', 'LineWidth', 2, 'MarkerSize', 8, 'MarkerFaceColor', 'b') configures the line style, marker symbol, and color using the LineSpec parameter ('--ro'). The resulting plot includes a dashed, red line with circle markers. The additional styling parameters ('LineWidth', 'MarkerSize', and 'MarkerFaceColor') further customize the appearance of the plot.
When code is executed in matlab command window the output is −
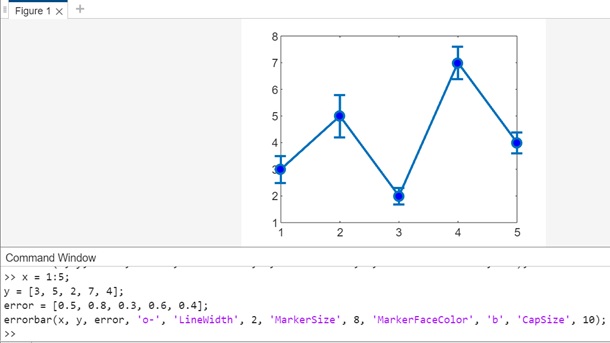
Example 6: Using errorbar(___,Name,Value)
The code for above syntax is −
x = 1:5;
y = [3, 5, 2, 7, 4];
error = [0.5, 0.8, 0.3, 0.6, 0.4];
errorbar(x, y, error, 'o-', 'LineWidth', 2, 'MarkerSize', 8, 'MarkerFaceColor', 'b', 'CapSize', 10);
In this example −
- x − Represents the x-coordinates of the data points.
- y − Corresponds to the y-coordinates of the data points.
- error − Specifies the error values associated with each data point.
The method errorbar(x, y, error, 'o-', 'LineWidth', 2, 'MarkerSize', 8, 'MarkerFaceColor', 'b', 'CapSize', 10) adjusts the visual aspects of the plot using name-value pair arguments. The 'CapSize', 10 pair sets the lengths of the caps at the end of each error bar to be 10 points.
When you execute the code inside matlab command window the output is −
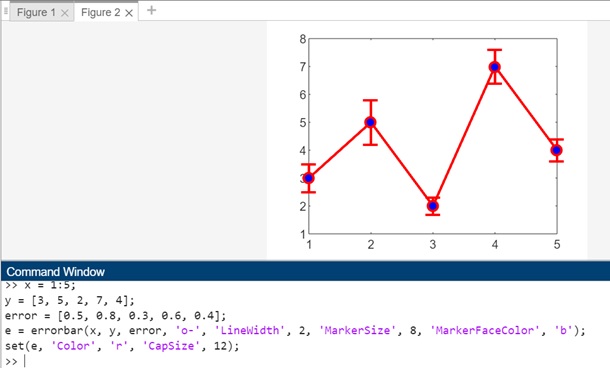
Example 7: Using e = errorbar(___)
The code for above syntax is −
x = 1:5;
y = [3, 5, 2, 7, 4];
error = [0.5, 0.8, 0.3, 0.6, 0.4];
e = errorbar(x, y, error, 'o-', 'LineWidth', 2, 'MarkerSize', 8, 'MarkerFaceColor', 'b');
set(e, 'Color', 'r', 'CapSize', 12);
In this example −
- x − Represents the x-coordinates of the data points.
- y − Corresponds to the y-coordinates of the data points.
- error − Specifies the error values associated with each data point.
The method, e = errorbar(x, y, error, 'o-', 'LineWidth', 2, 'MarkerSize', 8, 'MarkerFaceColor', 'b') creates an ErrorBar object (e) for the plotted line. This object can be used to adjust properties of the error bars after they have been created.
The subsequent set(e, 'Color', 'r', 'CapSize', 12) modifies the properties of the ErrorBar object. In this case, it changes the color of the error bars to red and sets the length of the caps at the end of each error bar to be 12 points.
When you execute the code in matlab command window the output is −