- MATLAB - Home
- MATLAB - Overview
- MATLAB - Features
- MATLAB - Environment Setup
- MATLAB - Editors
- MATLAB - Online
- MATLAB - Workspace
- MATLAB - Syntax
- MATLAB - Variables
- MATLAB - Commands
- MATLAB - Data Types
- MATLAB - Operators
- MATLAB - Dates and Time
- MATLAB - Numbers
- MATLAB - Random Numbers
- MATLAB - Strings and Characters
- MATLAB - Text Formatting
- MATLAB - Timetables
- MATLAB - M-Files
- MATLAB - Colon Notation
- MATLAB - Data Import
- MATLAB - Data Output
- MATLAB - Normalize Data
- MATLAB - Predefined Variables
- MATLAB - Decision Making
- MATLAB - Decisions
- MATLAB - If End Statement
- MATLAB - If Else Statement
- MATLAB - If…Elseif Else Statement
- MATLAB - Nest If Statememt
- MATLAB - Switch Statement
- MATLAB - Nested Switch
- MATLAB - Loops
- MATLAB - Loops
- MATLAB - For Loop
- MATLAB - While Loop
- MATLAB - Nested Loops
- MATLAB - Break Statement
- MATLAB - Continue Statement
- MATLAB - End Statement
- MATLAB - Arrays
- MATLAB - Arrays
- MATLAB - Vectors
- MATLAB - Transpose Operator
- MATLAB - Array Indexing
- MATLAB - Multi-Dimensional Array
- MATLAB - Compatible Arrays
- MATLAB - Categorical Arrays
- MATLAB - Cell Arrays
- MATLAB - Matrix
- MATLAB - Sparse Matrix
- MATLAB - Tables
- MATLAB - Structures
- MATLAB - Array Multiplication
- MATLAB - Array Division
- MATLAB - Array Functions
- MATLAB - Functions
- MATLAB - Functions
- MATLAB - Function Arguments
- MATLAB - Anonymous Functions
- MATLAB - Nested Functions
- MATLAB - Return Statement
- MATLAB - Void Function
- MATLAB - Local Functions
- MATLAB - Global Variables
- MATLAB - Function Handles
- MATLAB - Filter Function
- MATLAB - Factorial
- MATLAB - Private Functions
- MATLAB - Sub-functions
- MATLAB - Recursive Functions
- MATLAB - Function Precedence Order
- MATLAB - Map Function
- MATLAB - Mean Function
- MATLAB - End Function
- MATLAB - Error Handling
- MATLAB - Error Handling
- MATLAB - Try...Catch statement
- MATLAB - Debugging
- MATLAB - Plotting
- MATLAB - Plotting
- MATLAB - Plot Arrays
- MATLAB - Plot Vectors
- MATLAB - Bar Graph
- MATLAB - Histograms
- MATLAB - Graphics
- MATLAB - 2D Line Plot
- MATLAB - 3D Plots
- MATLAB - Formatting a Plot
- MATLAB - Logarithmic Axes Plots
- MATLAB - Plotting Error Bars
- MATLAB - Plot a 3D Contour
- MATLAB - Polar Plots
- MATLAB - Scatter Plots
- MATLAB - Plot Expression or Function
- MATLAB - Draw Rectangle
- MATLAB - Plot Spectrogram
- MATLAB - Plot Mesh Surface
- MATLAB - Plot Sine Wave
- MATLAB - Interpolation
- MATLAB - Interpolation
- MATLAB - Linear Interpolation
- MATLAB - 2D Array Interpolation
- MATLAB - 3D Array Interpolation
- MATLAB - Polynomials
- MATLAB - Polynomials
- MATLAB - Polynomial Addition
- MATLAB - Polynomial Multiplication
- MATLAB - Polynomial Division
- MATLAB - Derivatives of Polynomials
- MATLAB - Transformation
- MATLAB - Transforms
- MATLAB - Laplace Transform
- MATLAB - Laplacian Filter
- MATLAB - Laplacian of Gaussian Filter
- MATLAB - Inverse Fourier transform
- MATLAB - Fourier Transform
- MATLAB - Fast Fourier Transform
- MATLAB - 2-D Inverse Cosine Transform
- MATLAB - Add Legend to Axes
- MATLAB - Object Oriented
- MATLAB - Object Oriented Programming
- MATLAB - Classes and Object
- MATLAB - Functions Overloading
- MATLAB - Operator Overloading
- MATLAB - User-Defined Classes
- MATLAB - Copy Objects
- MATLAB - Algebra
- MATLAB - Linear Algebra
- MATLAB - Gauss Elimination
- MATLAB - Gauss-Jordan Elimination
- MATLAB - Reduced Row Echelon Form
- MATLAB - Eigenvalues and Eigenvectors
- MATLAB - Integration
- MATLAB - Integration
- MATLAB - Double Integral
- MATLAB - Trapezoidal Rule
- MATLAB - Simpson's Rule
- MATLAB - Miscellenous
- MATLAB - Calculus
- MATLAB - Differential
- MATLAB - Inverse of Matrix
- MATLAB - GNU Octave
- MATLAB - Simulink
MATLAB - Plot a 3D Contour
A contour is a curve that joins points of equal value on a surface or in a dataset. In the context of data visualization, contour lines are used to represent the variation of a function of two variables. These lines connect points with the same function value, forming curves that highlight regions of similar intensity or elevation.
In the case of a 3D contour plot, these curves exist on a three-dimensional surface. The contour lines represent the intersection of the surface with planes parallel to the XY-plane, and their patterns convey information about the shape and characteristics of the surface.
Creating a 3D contour plot in MATLAB can be a powerful way to visualize three-dimensional data. A 3D contour plot is a graphical representation of a three-dimensional surface that uses contour lines to display the variations in data. In MATLAB, you can create such plots to visualize functions of two variables. This type of plot is useful for understanding the structure and behavior of a surface in three-dimensional space.
In matlab we have following methods that helps in plotting of contour and they are −
- contour3
- surfc
Let us understand both the methods in detail.
Using contour3
The contour3 method in MATLAB is used to create three-dimensional contour plots. This function allows you to visualize the contours of a three-dimensional surface, displaying curves that connect points of equal function values.
Syntax
contour3(Z)
contour3(X,Y,Z)
contour3(___,levels)
contour3(___,LineSpec)
The detailed explanation of the syntax is as follows −
contour3(Z) − Generates a three-dimensional contour plot, illustrating isolines derived from the matrix Z. Z represents height values across the x-y plane.
contour3(X,Y,Z) − It provides the x and y coordinates for the values in Z.
contour3(___,levels) − If you set levels as a scalar, denoted by n, the function automatically displays contour lines at n appropriately chosen levels or heights. Alternatively, if you wish to draw the contours at specific heights, you can specify levels as a vector with monotonically increasing values. For contours at a single height k, use a two-element row vector [k k] as the levels parameter.
contour3(___,LineSpec) − Using this method you can change the style and color of the contour lines.
Let us see examples for each of the syntax specified above.
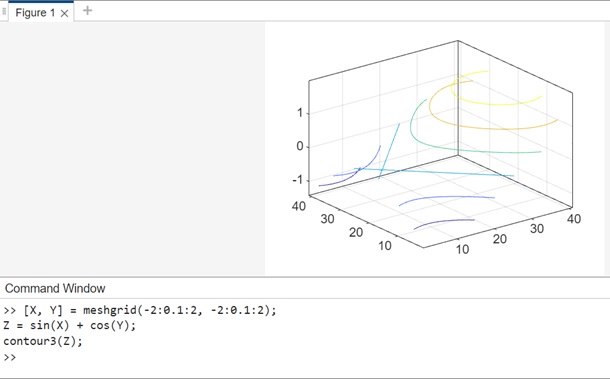
Example 1: Using contour3(Z)
The code for above syntax is as follows −
[X, Y] = meshgrid(-2:0.1:2, -2:0.1:2);
Z = sin(X) + cos(Y);
contour3(Z);
In this example −
- meshgrid is used to create a grid of X and Y values.
- The function Z = sin(X) + cos(Y) generates a matrix Z representing height values across the x-y plane.
Using contour3(Z) it creates a three-dimensional contour plot.The function automatically determines the contour lines to display based on the values in matrix Z.
When you execute the code in matlab command window the output is −
Example 2: Using contour3(X,Y,Z)
The code for above syntax is −
[X, Y] = meshgrid(-2:0.1:2, -2:0.1:2);
Z = sin(X) + cos(Y);
contour3(X, Y, Z);
In this example −
- meshgrid is used to create a grid of X and Y values.
- The function Z = sin(X) + cos(Y) generates a matrix Z representing height values across the x-y plane.
The function contour3(X, Y, Z) is used to create a three-dimensional contour plot.The X and Y matrices provide the coordinates for the values in Z.
When you execute the code in matlab command window the output is −

Example 3: Using contour3(___,levels)
The code for above syntax is −
[X, Y] = meshgrid(-2:0.1:2, -2:0.1:2);
Z = sin(X) + cos(Y);
contour3(X, Y, Z, [0, 0.5, 1]);
In this example −
- meshgrid is used to create a grid of X and Y values.
- The function Z = sin(X) + cos(Y) generates a matrix Z representing height values across the x-y plane.
The function contour3(X, Y, Z, [0, 0.5, 1]) is used to create a three-dimensional contour plot.The vector [0, 0.5, 1] specifies specific contour levels.
When you execute the code in matlab command window the output is −

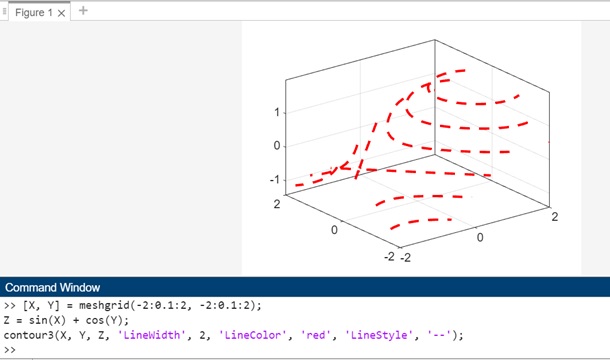
Example 4: contour3(___,LineSpec)
The code for above syntax is −
[X, Y] = meshgrid(-2:0.1:2, -2:0.1:2);
Z = sin(X) + cos(Y);
contour3(X, Y, Z, 'LineWidth', 2, 'LineColor', 'red', 'LineStyle', '--');
In this example −
- meshgrid is used to create a grid of X and Y values.
- The function Z = sin(X) + cos(Y) generates a matrix Z representing height values across the x-y plane.
The method contour3(X, Y, Z, 'LineWidth', 2, 'LineColor', 'red', 'LineStyle', '--') is used to create a three-dimensional contour plot with customized line style and color.
- The options 'LineWidth', 2 specify a line width of 2 points.
- The options 'LineColor', 'red' specify a red color for the contour lines.
- The options 'LineStyle', '--' specify a dashed line style.
When you execute the code in matlab command window the output is −
Using surfc()
The surfc() function in MATLAB is used to create a 3D surface plot with contours displayed on the surface. It combines the visualization of the surface plot with contour lines, providing a comprehensive view of the underlying data. The name "surfc" stands for "surface with contours."
Syntax
surfc(X,Y,Z)
surfc(X,Y,Z,C)
surfc(___,Name,Value)
Here is a detailed explanation of the syntax mentioned above −
surfc(X,Y,Z) − Function generates a 3D surface plot with an underlying contour plot. In this visualization, the surface represents a three-dimensional structure with distinct solid edge and face colors. The plotted surface is based on the values in the matrix Z, which are interpreted as heights above a grid in the x-y plane defined by X and Y. The color of the surface varies in accordance with the specified heights in the Z matrix.
surfc(X,Y,Z,C) − Provides explicit control over the surface color in the generated plot.
surfc(___,Name,Value) − Allows the specification of surface properties through one or more name-value pair arguments.
Example 1: Using surfc(X,Y,Z)
The code for the syntax is −
[X, Y] = meshgrid(-2:0.1:2, -2:0.1:2);
Z = sin(sqrt(X.^2 + Y.^2));
surfc(X, Y, Z);
In this example −
- meshgrid is used to create a grid in the x-y plane.
- The function sin(sqrt(X.^2 + Y.^2)) is used to define the surface heights based on X and Y.
- The surfc() function is then used to create a 3D surface plot with an underlying contour plot based on the specified X, Y, and Z values.
When you execute the code in matlab command window the output is −

Example 2: Using surfc(X,Y,Z,C)
The code for above syntax is −
[X, Y] = meshgrid(-2:0.1:2, -2:0.1:2);
Z = peaks(X, Y);
C = Z;
surfc(X, Y, Z, C);
In this example −
- The peaks function is used to generate a sample surface defined by X and Y.
- The matrix C is set equal to the Z values, indicating that color values for each point in the surface plot are determined by the corresponding heights in the Z matrix.
- The surfc() function is then used to create a 3D surface plot with explicit control over the surface color.
When you execute the code in matlab command window the output is −

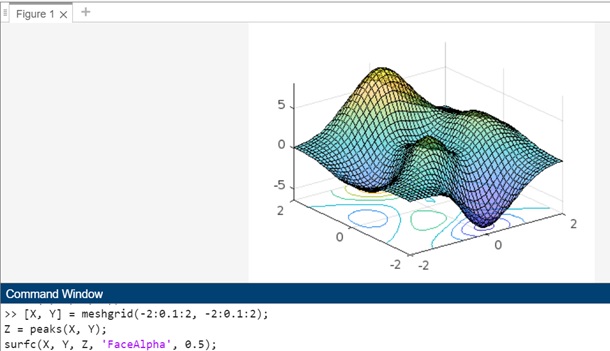
Example 3: Using syntax surfc(___,Name,Value)
The code for above syntax is −
[X, Y] = meshgrid(-2:0.1:2, -2:0.1:2);
Z = peaks(X, Y);
surfc(X, Y, Z, 'FaceAlpha', 0.5);
In this example −
- The grid in the x-y plane is defined using meshgrid.
- The peaks function is used to generate a sample surface defined by X and Y.
- The 'FaceAlpha', 0.5 name-value pair argument is used with surfc() to set the transparency of the surface to 0.5, making it semi transparent.
When you execute the code in matlab command window the output is −