- MATLAB - Home
- MATLAB - Overview
- MATLAB - Features
- MATLAB - Environment Setup
- MATLAB - Editors
- MATLAB - Online
- MATLAB - Workspace
- MATLAB - Syntax
- MATLAB - Variables
- MATLAB - Commands
- MATLAB - Data Types
- MATLAB - Operators
- MATLAB - Dates and Time
- MATLAB - Numbers
- MATLAB - Random Numbers
- MATLAB - Strings and Characters
- MATLAB - Text Formatting
- MATLAB - Timetables
- MATLAB - M-Files
- MATLAB - Colon Notation
- MATLAB - Data Import
- MATLAB - Data Output
- MATLAB - Normalize Data
- MATLAB - Predefined Variables
- MATLAB - Decision Making
- MATLAB - Decisions
- MATLAB - If End Statement
- MATLAB - If Else Statement
- MATLAB - If…Elseif Else Statement
- MATLAB - Nest If Statememt
- MATLAB - Switch Statement
- MATLAB - Nested Switch
- MATLAB - Loops
- MATLAB - Loops
- MATLAB - For Loop
- MATLAB - While Loop
- MATLAB - Nested Loops
- MATLAB - Break Statement
- MATLAB - Continue Statement
- MATLAB - End Statement
- MATLAB - Arrays
- MATLAB - Arrays
- MATLAB - Vectors
- MATLAB - Transpose Operator
- MATLAB - Array Indexing
- MATLAB - Multi-Dimensional Array
- MATLAB - Compatible Arrays
- MATLAB - Categorical Arrays
- MATLAB - Cell Arrays
- MATLAB - Matrix
- MATLAB - Sparse Matrix
- MATLAB - Tables
- MATLAB - Structures
- MATLAB - Array Multiplication
- MATLAB - Array Division
- MATLAB - Array Functions
- MATLAB - Functions
- MATLAB - Functions
- MATLAB - Function Arguments
- MATLAB - Anonymous Functions
- MATLAB - Nested Functions
- MATLAB - Return Statement
- MATLAB - Void Function
- MATLAB - Local Functions
- MATLAB - Global Variables
- MATLAB - Function Handles
- MATLAB - Filter Function
- MATLAB - Factorial
- MATLAB - Private Functions
- MATLAB - Sub-functions
- MATLAB - Recursive Functions
- MATLAB - Function Precedence Order
- MATLAB - Map Function
- MATLAB - Mean Function
- MATLAB - End Function
- MATLAB - Error Handling
- MATLAB - Error Handling
- MATLAB - Try...Catch statement
- MATLAB - Debugging
- MATLAB - Plotting
- MATLAB - Plotting
- MATLAB - Plot Arrays
- MATLAB - Plot Vectors
- MATLAB - Bar Graph
- MATLAB - Histograms
- MATLAB - Graphics
- MATLAB - 2D Line Plot
- MATLAB - 3D Plots
- MATLAB - Formatting a Plot
- MATLAB - Logarithmic Axes Plots
- MATLAB - Plotting Error Bars
- MATLAB - Plot a 3D Contour
- MATLAB - Polar Plots
- MATLAB - Scatter Plots
- MATLAB - Plot Expression or Function
- MATLAB - Draw Rectangle
- MATLAB - Plot Spectrogram
- MATLAB - Plot Mesh Surface
- MATLAB - Plot Sine Wave
- MATLAB - Interpolation
- MATLAB - Interpolation
- MATLAB - Linear Interpolation
- MATLAB - 2D Array Interpolation
- MATLAB - 3D Array Interpolation
- MATLAB - Polynomials
- MATLAB - Polynomials
- MATLAB - Polynomial Addition
- MATLAB - Polynomial Multiplication
- MATLAB - Polynomial Division
- MATLAB - Derivatives of Polynomials
- MATLAB - Transformation
- MATLAB - Transforms
- MATLAB - Laplace Transform
- MATLAB - Laplacian Filter
- MATLAB - Laplacian of Gaussian Filter
- MATLAB - Inverse Fourier transform
- MATLAB - Fourier Transform
- MATLAB - Fast Fourier Transform
- MATLAB - 2-D Inverse Cosine Transform
- MATLAB - Add Legend to Axes
- MATLAB - Object Oriented
- MATLAB - Object Oriented Programming
- MATLAB - Classes and Object
- MATLAB - Functions Overloading
- MATLAB - Operator Overloading
- MATLAB - User-Defined Classes
- MATLAB - Copy Objects
- MATLAB - Algebra
- MATLAB - Linear Algebra
- MATLAB - Gauss Elimination
- MATLAB - Gauss-Jordan Elimination
- MATLAB - Reduced Row Echelon Form
- MATLAB - Eigenvalues and Eigenvectors
- MATLAB - Integration
- MATLAB - Integration
- MATLAB - Double Integral
- MATLAB - Trapezoidal Rule
- MATLAB - Simpson's Rule
- MATLAB - Miscellenous
- MATLAB - Calculus
- MATLAB - Differential
- MATLAB - Inverse of Matrix
- MATLAB - GNU Octave
- MATLAB - Simulink
MATLAB - Debugging
Debugging helps identify and fix errors or issues in your code, making sure that your programs run correctly.
Before we understand the details of how to start debugging let us list out the common types of errors that occur in matlab programs.
- Syntax Errors − These occur due to incorrect code structure, such as missing or mismatched parentheses, commas, or semicolons.
- Runtime Errors − These happen while the code is executing, typically due to issues like division by zero or accessing nonexistent variables.
- Logical Errors − These are the trickiest, as they don't trigger error messages but produce incorrect results. Debugging these often involves carefully examining the algorithm's logic.
Let us understand debugging in matlab in detail.
Using the MATLAB Editor
MATLAB's integrated development environment (IDE) includes the MATLAB Editor, which offers several features to aid debugging −
- Syntax Highlighting − It helps you spot syntax errors by coloring code elements differently.
- Code Folding − Organize your code for better readability and easier debugging.
- Code Suggestions − MATLAB can offer auto-suggestions for functions and variables, reducing typographical errors.
Here are a few examples.
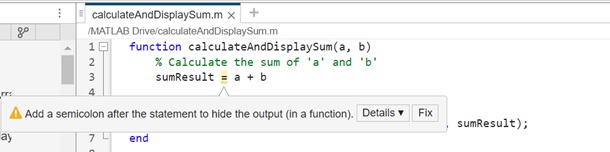
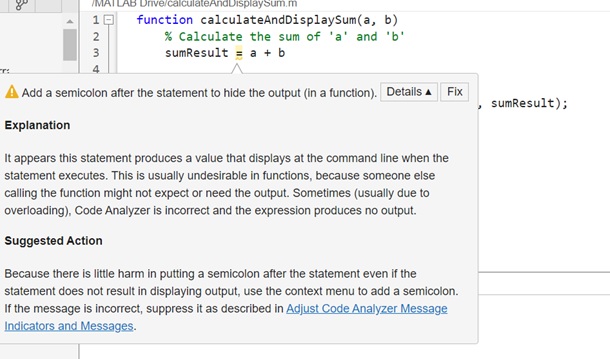
The syntax highlights tells about the issue with your code as shown above in the screenshot. I have missed the semicolon at line no 3. It also gives the details options onclick of it you will see following −
Clicking on the fix button will add a semicolon to line no 3 which is missing now.
Let us take another example of syntax error −
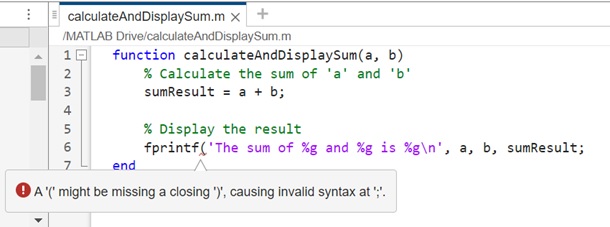
Here at line no 6 i have missed the closing bracket for fprintf(). The error highlights the issue coming up as shown in the screenshot above.
Breakpoints in Matlab
Breakpoints act like markers placed within your MATLAB code to interrupt the execution at a marker point. When the code reaches a breakpoint, it pauses, allowing you to inspect variables, check the program state, and analyze the code's behavior.
You can add breakpoint as shown below −
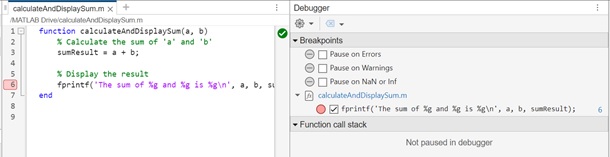
Click on the line number where you wish to add breakpoint. The line no will be highlighted as shown above in the screenshot. At the right side you see the Breakpoints section and it has breakpoint details on the function calculateAndDisplaySum.m.
Now when you call the function calculateAndDisplaySum, it will halt at line no 6 during execution. You can inspect all the line numbers prior to the breakpoint to make sure the variables and the logic in the function is giving proper results.
Pause and Inspection for Breakpoints in Matlab
The code execution halts at the breakpoint, allowing you to inspect variables, check their values, and evaluate expressions in the Command Window or the "Variables" panel.
Here is the execution flow in matlab −
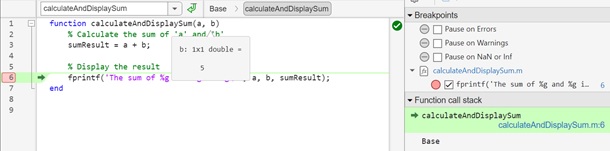

When you bring your cursor on the variables it displays the value of the variable used in the function as shown above in the screenshot.
Actions at Breakpoints
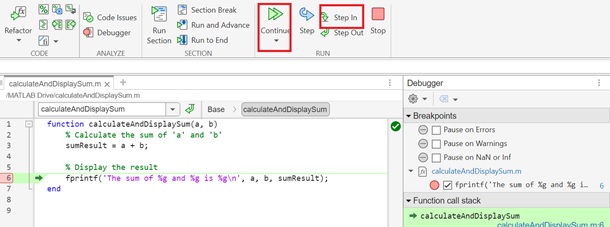
After the code is paused at a breakpoint, you can step through the code line-by-line using the debugger controls (Step, Step In, Step Out).
Resume code execution from the breakpoint using the "Continue" button highlighted in red.
Debug Using Run in Matlab
To execute code up to a designated line and then pause, select the "Run to Cursor" button situated left of that line. If the chosen line isn't immediately accessible, MATLAB will continue running the code until it reaches the end of the file or encounters a breakpoint.
Example
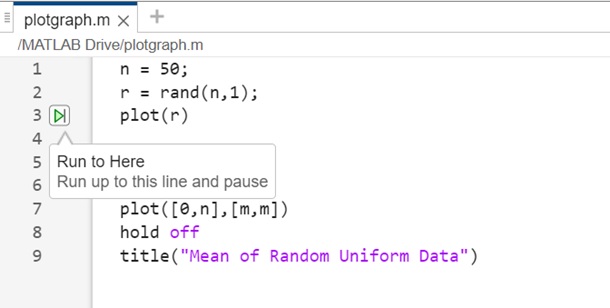
During the debugging process, the "Run to Here" button transforms into the "Continue to Here" button. Within functions and classes, the capability to execute up to a specific line and pause is accessible exclusively through the "Continue to Here" button during debugging.
When MATLAB enters a paused state, several alterations take place −
- The Run button in the Editor or Live Editor tab transforms into a Continue button.
- The Command Window prompt shifts to K>>, denoting MATLAB's debug mode where the keyboard assumes control.
- MATLAB marks the paused line with a green arrow and highlights it in green for easy identification.

The line where MATLAB pauses remains inactive until you choose to proceed with code execution. To resume, simply click the Continue button. MATLAB will then continue executing the file until it reaches its conclusion or encounters a breakpoint. Alternatively, you can select the Continue to Here button situated left of the desired code line to resume execution to that point.
Some Useful Methods That Helps in Code Debugging
Here are some useful techniques to help you debug your code more effectively −
Using codeIssues() Method
In MATLAB, codeIssues is a container object that holds information about issues identified by the Code Analyzer. The issues variable is used to store or reference information from the codeIssues object.
Syntax
issues = codeIssues  : this takes care of issues with code related to the current folder and returns codeIssues object.

issues = codeIssues(names) : Here you can specify the name of the folder or file name for which you wish to issue the code issues.
Example
In the example we wish to see the issues related to the add.m file.
issues = codeIssues("add.m")
On execution you get the following output −
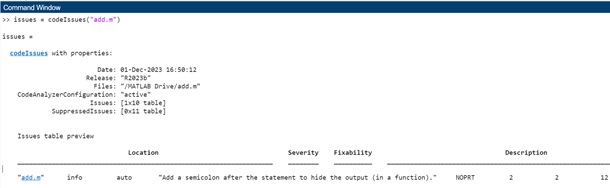
>> issues = codeIssues("add.m")

issues =

   codeIssues with properties:

      Date: 01-Dec-2023 16:48:56
      Release: "R2023b"
      Files: "/MATLAB Drive/add.m"
      CodeAnalyzerConfiguration: "active"
      Issues: [0x10 table]
      SuppressedIssues: [0x11 table]

>>
Right now we see that there are no issues with the add.m file. Let us make some mistake and see if the same is shown back when using codeIssues() method.
Consider the add.m file with semicolon missing on the line : 2 as shown in the screenshot below −
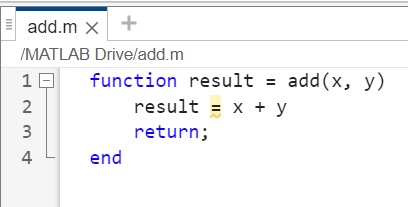
On execution of issues = codeIssues("add.m") gives following details in matlab command window −
Using checkcode() method
This method displays the possible problem for the given filename.
Syntax
checkcode(filename) : give the filename here for which you wish to see the code issues.
Example
The checkcode function examines the MATLAB script file add.m for potential issues.
checkcode('add.m')
On execution in matlab command window you will get following output −
>> checkcode('add.m')
L 2 (C 12): Add a semicolon after the statement to hide the output (in a function).
