- MATLAB - Home
- MATLAB - Overview
- MATLAB - Features
- MATLAB - Environment Setup
- MATLAB - Editors
- MATLAB - Online
- MATLAB - Workspace
- MATLAB - Syntax
- MATLAB - Variables
- MATLAB - Commands
- MATLAB - Data Types
- MATLAB - Operators
- MATLAB - Dates and Time
- MATLAB - Numbers
- MATLAB - Random Numbers
- MATLAB - Strings and Characters
- MATLAB - Text Formatting
- MATLAB - Timetables
- MATLAB - M-Files
- MATLAB - Colon Notation
- MATLAB - Data Import
- MATLAB - Data Output
- MATLAB - Normalize Data
- MATLAB - Predefined Variables
- MATLAB - Decision Making
- MATLAB - Decisions
- MATLAB - If End Statement
- MATLAB - If Else Statement
- MATLAB - If…Elseif Else Statement
- MATLAB - Nest If Statememt
- MATLAB - Switch Statement
- MATLAB - Nested Switch
- MATLAB - Loops
- MATLAB - Loops
- MATLAB - For Loop
- MATLAB - While Loop
- MATLAB - Nested Loops
- MATLAB - Break Statement
- MATLAB - Continue Statement
- MATLAB - End Statement
- MATLAB - Arrays
- MATLAB - Arrays
- MATLAB - Vectors
- MATLAB - Transpose Operator
- MATLAB - Array Indexing
- MATLAB - Multi-Dimensional Array
- MATLAB - Compatible Arrays
- MATLAB - Categorical Arrays
- MATLAB - Cell Arrays
- MATLAB - Matrix
- MATLAB - Sparse Matrix
- MATLAB - Tables
- MATLAB - Structures
- MATLAB - Array Multiplication
- MATLAB - Array Division
- MATLAB - Array Functions
- MATLAB - Functions
- MATLAB - Functions
- MATLAB - Function Arguments
- MATLAB - Anonymous Functions
- MATLAB - Nested Functions
- MATLAB - Return Statement
- MATLAB - Void Function
- MATLAB - Local Functions
- MATLAB - Global Variables
- MATLAB - Function Handles
- MATLAB - Filter Function
- MATLAB - Factorial
- MATLAB - Private Functions
- MATLAB - Sub-functions
- MATLAB - Recursive Functions
- MATLAB - Function Precedence Order
- MATLAB - Map Function
- MATLAB - Mean Function
- MATLAB - End Function
- MATLAB - Error Handling
- MATLAB - Error Handling
- MATLAB - Try...Catch statement
- MATLAB - Debugging
- MATLAB - Plotting
- MATLAB - Plotting
- MATLAB - Plot Arrays
- MATLAB - Plot Vectors
- MATLAB - Bar Graph
- MATLAB - Histograms
- MATLAB - Graphics
- MATLAB - 2D Line Plot
- MATLAB - 3D Plots
- MATLAB - Formatting a Plot
- MATLAB - Logarithmic Axes Plots
- MATLAB - Plotting Error Bars
- MATLAB - Plot a 3D Contour
- MATLAB - Polar Plots
- MATLAB - Scatter Plots
- MATLAB - Plot Expression or Function
- MATLAB - Draw Rectangle
- MATLAB - Plot Spectrogram
- MATLAB - Plot Mesh Surface
- MATLAB - Plot Sine Wave
- MATLAB - Interpolation
- MATLAB - Interpolation
- MATLAB - Linear Interpolation
- MATLAB - 2D Array Interpolation
- MATLAB - 3D Array Interpolation
- MATLAB - Polynomials
- MATLAB - Polynomials
- MATLAB - Polynomial Addition
- MATLAB - Polynomial Multiplication
- MATLAB - Polynomial Division
- MATLAB - Derivatives of Polynomials
- MATLAB - Transformation
- MATLAB - Transforms
- MATLAB - Laplace Transform
- MATLAB - Laplacian Filter
- MATLAB - Laplacian of Gaussian Filter
- MATLAB - Inverse Fourier transform
- MATLAB - Fourier Transform
- MATLAB - Fast Fourier Transform
- MATLAB - 2-D Inverse Cosine Transform
- MATLAB - Add Legend to Axes
- MATLAB - Object Oriented
- MATLAB - Object Oriented Programming
- MATLAB - Classes and Object
- MATLAB - Functions Overloading
- MATLAB - Operator Overloading
- MATLAB - User-Defined Classes
- MATLAB - Copy Objects
- MATLAB - Algebra
- MATLAB - Linear Algebra
- MATLAB - Gauss Elimination
- MATLAB - Gauss-Jordan Elimination
- MATLAB - Reduced Row Echelon Form
- MATLAB - Eigenvalues and Eigenvectors
- MATLAB - Integration
- MATLAB - Integration
- MATLAB - Double Integral
- MATLAB - Trapezoidal Rule
- MATLAB - Simpson's Rule
- MATLAB - Miscellenous
- MATLAB - Calculus
- MATLAB - Differential
- MATLAB - Inverse of Matrix
- MATLAB - GNU Octave
- MATLAB - Simulink
MATLAB - Bar Graph
Creating bar graphs in MATLAB is a fundamental way to visualize categorical data. Bar graphs in MATLAB represent categorical data through bars of varying heights. The bar function is used to create these plots.
Syntax
bar(y)
bar(x,y)
bar(___,width)
bar(___,style)
bar(___,color)
bar(___,Name,Value)
bar(ax,___)
b = bar(___)
Let us understand the syntax in detail here −
bar(y) − The function bar(y) generates a bar chart featuring a bar for each element within the dataset y.For plotting a single set of bars, input y as a vector comprising m elements. These bars are positioned between 1 and m along the x-axis.To represent multiple sets of bars, provide y as a matrix where each column symbolizes a distinct series of data.
bar(x,y) − positions the bars precisely at the designated locations indicated by the values in x.
bar(___,width) − allows adjustment of the relative bar width, influencing the spacing between bars within a group. Define width as a single numeric value. Apply this feature in conjunction with any of the input argument combinations demonstrated earlier.
bar(___,style) − defines the appearance of bar groups. For instance, select 'stacked' to exhibit each group as a single bar with multiple colors.
bar(___,color) − gives a uniform color for all bars. For instance, designate 'r' to represent red-colored bars.
bar(___,Name,Value) − allows customization of bar graph properties using various name-value pair arguments. These are supported solely for bar graphs utilizing the default 'grouped' or 'stacked' styles.
bar(ax,___) − the function plots on the axes defined by ax rather than the current axes (gca). The ax option can come before any of the input argument combinations demonstrated earlier.
b = bar(___) − generates one or more Bar objects. When y is a vector, a single Bar object is created. In the case of y being a matrix, bar produces a Bar object for each series. Utilize b to modify bar properties once the bar graph is displayed.
Create Bar Graph
Example 1
Here let us create a simple bar graph as shown in the example below−
y = [50, 85, 110, 135, 155, 180, 210, 230, 255, 280, 300];
bar(y)
Now when you execute the same in the matlab command window the output is −

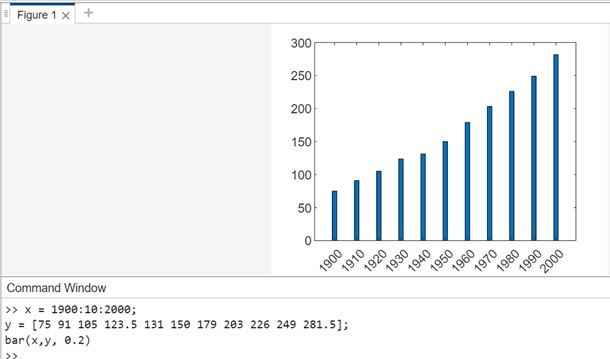
Example 2
Here we are going to make use of x and y vectors to create a bar graph as shown below −
x = 1900:10:2000;
y = [75 91 105 123.5 131 150 179 203 226 249 281.5];
bar(x,y)
This code will generate a bar graph with bars representing population growth over decades, where the x-axis denotes the years and the y-axis shows the population in millions.
The output on execution in matlab command window is as follows −

Example 3
This example shows how to use width on the bar graph Will make use of the same values for x and y as used in the example above.
x = 1900:10:2000;
y = [75 91 105 123.5 131 150 179 203 226 249 281.5];
bar(x,y, 0.2)
On execution in matlab the output is −
Example 4 : Groups of bars together
In this example will plot 5 groups of three bars along the x-axis.
Y = [5,2,1
     8,7,3
     9,8,6
     5,5,5
     4,3,2];

bar(Y)
On execution the output is −

Example 5 : Stacked Bars.
Stacking the bar together, and displaying one bar with the height of the bar equal to the sum of rows.
Y = [5,2,1
     8,7,3
     9,8,6
     5,5,5
     4,3,2];

bar(Y,'stacked')
The output on execution is −

Example 6 : Displaying negative data on bar graphs.
Y = [5,-2,1
   8,7,3
   -9,8,6
   5,5,-5
   -4,3,22];

bar(Y,stacked)
The output on execution is −

Example 7: Giving color to the bar graph
In the example below will give a green color to the bar graph as shown below −
y = [50, 85, 110, 135, 155, 180, 210, 230, 255, 280, 300];
bar(y,'g')
The code on execution on matlab command window is as follows −

Example 8 : To give interior and outline color to the bar graph
The example below will give an outline and interior color using RGB.
y = [50, 85, 110, 135, 155, 180, 210, 230, 255, 280, 300];
bar(y,'FaceColor',[0 .3 .2],'EdgeColor',[0 .7 .7],'LineWidth',1.8)
On execution in matlab command window the output is −

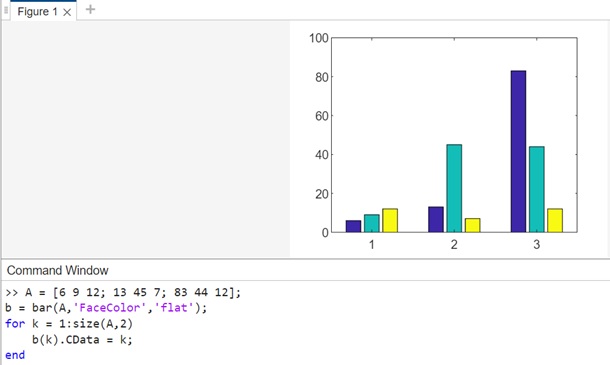
Example 9 : Bar Chart with Colormap Colors
Generate a bar graph employing colormap colors by configuring the FaceColor property to 'flat'. Afterwards, assign an integer to the CData property for each Bar object.
The code is as follows −
A = [6 9 12; 13 45 7; 83 44 12];
b = bar(A,'FaceColor','flat');
for k = 1:size(A,2)
   b(k).CData = k;
end
After execution in matlab the output is −