- SAP Dashboards - Home
- SAP Dashboards - Introduction
- SAP Dashboards - Version
- SAP Dashboards - WorkSpace
- SAP Dashboards - Font Options
- Components Browser
- SAP Dashboards - Object Browser
- SAP Dashboards - Quick Views
- Docking/Undocking
- Working With Components
- SAP Dashboards - Properties Panel
- Binding Components
- Setting Component Properties
- Configure Component Properties
- Component Colors
- Setting Component Text
- Chart Components
- Container Components
- Selector Components
- Single Value Components
- SAP Dashboards - Map Components
- SAP Dashboards - Text Components
- Web Connectivity Components
- Universe Connectivity
- Deleting Components & Alerts
- Models & Templates
- SAP Dashboards - Themes
- SAP Dashboards - Color Schemes
- Previewing Models
- Working With Data Sources
- SAP Dashboards - Data Connections
- Export Format Options
- Dynamic Dashboard
SAP Dashboards - Version
Earlier this Dashboard Designer was known as Xcelsius in SAP Business Objects 3.x version. It was also called Crystal Dashboard when Business Objects was not a product suite of SAP.
When Business Objects was acquired by SAP, the products were renamed as follows −
BOXI 3.1 compatible Dashboard is called Xcelsius 2008.
BOXI 4.0 compatible Dashboard is called Dashboard 4.0.
BOXI 4.1 compatible Dashboard is called Dashboard 4.1.
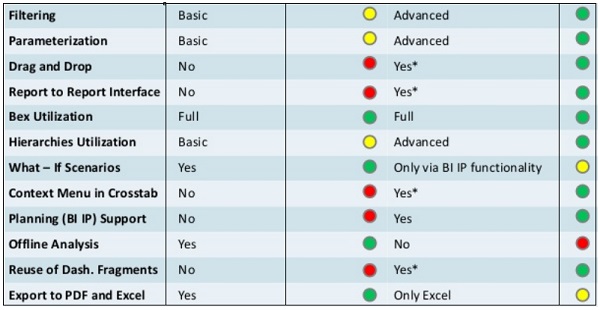
SAP Dashboards Vs Design Studio
SAP Dashboards Designer and Design Studio both are excellent tools for creating dashboards and support advanced features. The selection to choose one over other purely depends on the client requirements and system landscape.
| Features | Dashboards Designer | Design Studio |
|---|---|---|
| Chart Types | There are 22 charts of 16 types | 34 charts of 12 types |
| Selectors | 18 Selectors of 16 types | 10 Selectors of 10 Types |
| Containers | 7 Containers of 3 Types | 5 Container of 5 Types |
| Maps | For 100 Countries | No Maps |
| Calendar | Calendar is available as table | Calendar is available as input field |
| Filter Panel | No filter Panel | Drilling and Filtering Capabilities |
| What−If Component | 6 components | No components |
| Visualization Engine | Adobe Flash with HTML5 support | Native HTML with CSS |
| Design and Color Schemes | Multiple themes, customize using GUI | Basic themes, customized using CSS |
Sample Models
Sample models can be used to check how the different functions work in Dashboards and how you can use these functions in your own model. Each sample model includes own embedded spreadsheets data to check how different components are bound to data in spreadsheets.
You can check sample models in Dashboard by going to the File option at the top.
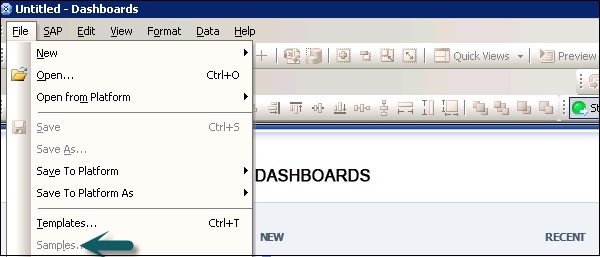
Under Category → User Guide Samples → Items list → OK
