- SAP Dashboards - Home
- SAP Dashboards - Introduction
- SAP Dashboards - Version
- SAP Dashboards - WorkSpace
- SAP Dashboards - Font Options
- Components Browser
- SAP Dashboards - Object Browser
- SAP Dashboards - Quick Views
- Docking/Undocking
- Working With Components
- SAP Dashboards - Properties Panel
- Binding Components
- Setting Component Properties
- Configure Component Properties
- Component Colors
- Setting Component Text
- Chart Components
- Container Components
- Selector Components
- Single Value Components
- SAP Dashboards - Map Components
- SAP Dashboards - Text Components
- Web Connectivity Components
- Universe Connectivity
- Deleting Components & Alerts
- Models & Templates
- SAP Dashboards - Themes
- SAP Dashboards - Color Schemes
- Previewing Models
- Working With Data Sources
- SAP Dashboards - Data Connections
- Export Format Options
- Dynamic Dashboard
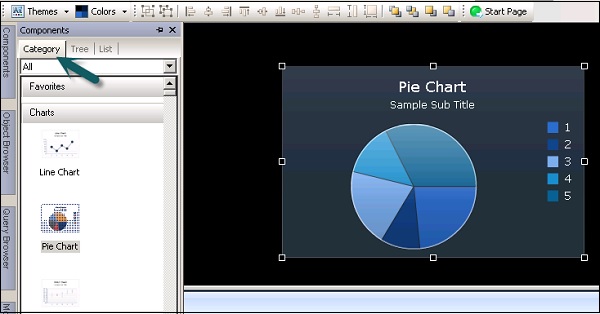
SAP Dashboards - Components Browser
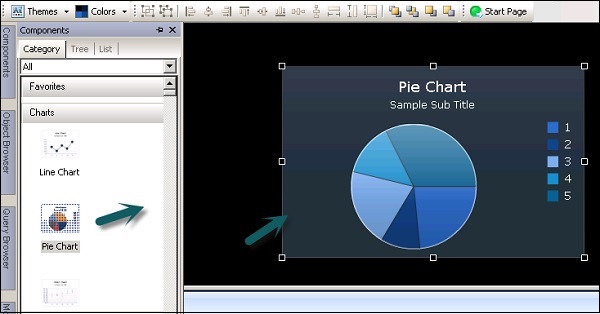
This browser provides you with a list of all the components that are available to add to the model in Dashboard. You can drag these components to Canvas.
You can also view the components under Tree and List as per the functional category.
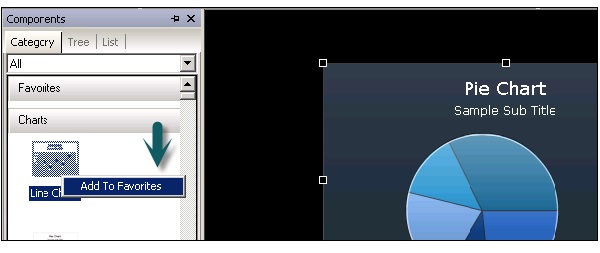
Favorites − These are available under Category and Tree view. To add a component to Favorite, right click on the component → Add to Favorites.
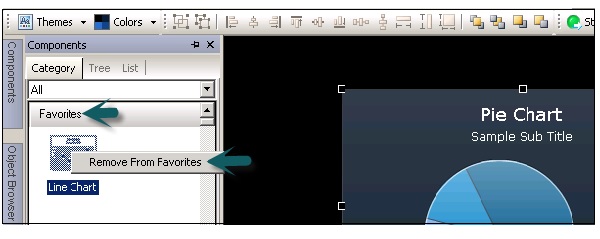
Once you add a component to Favorite, you can see it under the Favorite tab. To remove the component, right click → Remove from Favorites as shown in the following screenshot.
Charts − Charts are used to perform comparison, trend and patterns.
Containers − Container components group and display other components.
Selectors − It allows dashboard consumer to select data at run time.
Maps − It is used to display data by region.
Category View − Components are grouped in a sliding view and you can scroll down to open each category.
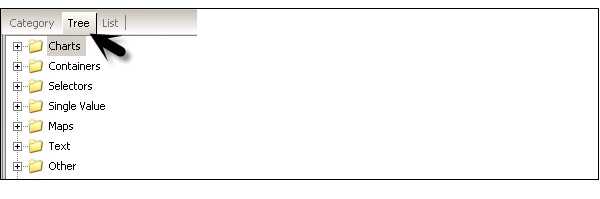
Tree View − In tree view, the components are organized in folders as per their category. You can click on the folders to see what all categories are there and check the list of available components as well.
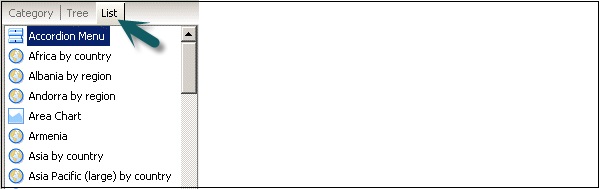
List View − In list view, the components are arranged in alphabetical order and they are not grouped based on the category.