- SAP Dashboards - Home
- SAP Dashboards - Introduction
- SAP Dashboards - Version
- SAP Dashboards - WorkSpace
- SAP Dashboards - Font Options
- Components Browser
- SAP Dashboards - Object Browser
- SAP Dashboards - Quick Views
- Docking/Undocking
- Working With Components
- SAP Dashboards - Properties Panel
- Binding Components
- Setting Component Properties
- Configure Component Properties
- Component Colors
- Setting Component Text
- Chart Components
- Container Components
- Selector Components
- Single Value Components
- SAP Dashboards - Map Components
- SAP Dashboards - Text Components
- Web Connectivity Components
- Universe Connectivity
- Deleting Components & Alerts
- Models & Templates
- SAP Dashboards - Themes
- SAP Dashboards - Color Schemes
- Previewing Models
- Working With Data Sources
- SAP Dashboards - Data Connections
- Export Format Options
- Dynamic Dashboard
SAP Dashboards - Introduction
In this chapter, we will begin with discussing about the basics of what SAP Dashboard is and how it evolved.
What is SAP Dashboard?
Dashboard designer is a SAP Business Objects Data Visualization Tool that is used to create interactive dashboards from different data sources. Dashboard designer allows BI developers to create custom dashboards from almost any type of data source to meet the business requirements in an organization.
Dashboards can include different graphs, charts and gauge that are based on the data provided by data sources. Dashboards are used by Senior Management that offers up to date information to information to company CEOs and VPs.
SAP Dashboard Overview
Consider that you have been promoted to the position of CEO of a company and you want to head a board meeting that shows your companys annual sales growth in different regions.
SAP Business Objects allow you to create dynamic corporate Dashboards for business presentations that looks user interactive and provides the information in quick up to date summary form.
A Dashboard will contain −
A tab that contains a dynamic chart that contains profit margin by product line, region and Year.
A tab that contains a chart showing sales versus profit margin.
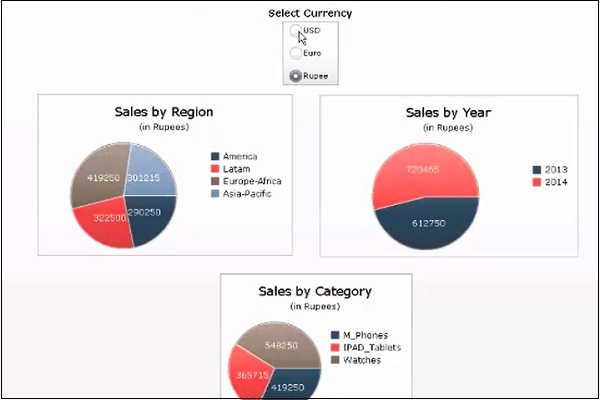
In the above image, a currency convertor option has been added, to see $ by value in different currencies.
