- SAP Dashboards - Home
- SAP Dashboards - Introduction
- SAP Dashboards - Version
- SAP Dashboards - WorkSpace
- SAP Dashboards - Font Options
- Components Browser
- SAP Dashboards - Object Browser
- SAP Dashboards - Quick Views
- Docking/Undocking
- Working With Components
- SAP Dashboards - Properties Panel
- Binding Components
- Setting Component Properties
- Configure Component Properties
- Component Colors
- Setting Component Text
- Chart Components
- Container Components
- Selector Components
- Single Value Components
- SAP Dashboards - Map Components
- SAP Dashboards - Text Components
- Web Connectivity Components
- Universe Connectivity
- Deleting Components & Alerts
- Models & Templates
- SAP Dashboards - Themes
- SAP Dashboards - Color Schemes
- Previewing Models
- Working With Data Sources
- SAP Dashboards - Data Connections
- Export Format Options
- Dynamic Dashboard
SAP Dashboards - Binding Components
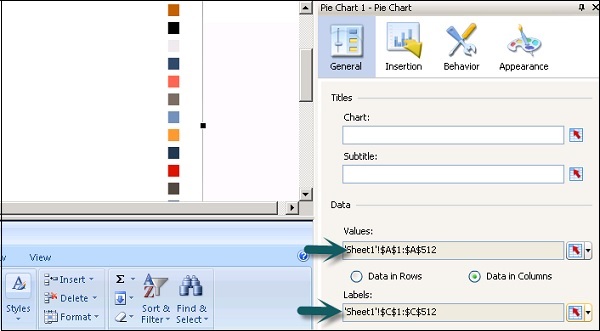
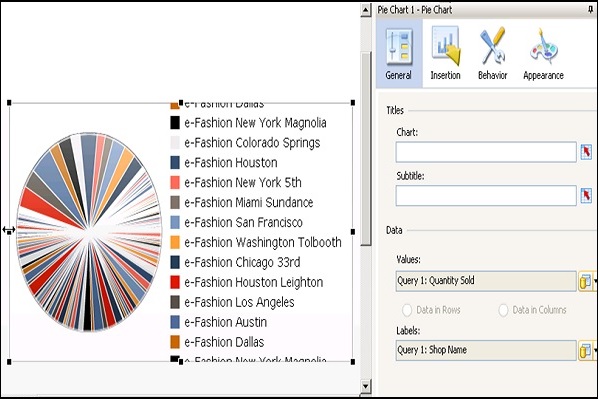
To create a data model in the Dashboard designer, you need to bind the components to data sources. If you want to display numerical data in charts, maps and tables you need to perform binding
You can also bind component parameters to set parameters like titles, colors, visibility to data sources. Components can bind to cells in spreadsheets or to query in query browser.
Component Binding can be performed in the following two ways −
Embedded Spreadsheets
You can link the component data sets and parameters to source data in embedded spreadsheets. You have to specify each cell in spreadsheet that contains data for parameters or data set. Data can be added to cells manually or by connecting to external sources.
You can also use few components to write data to spread sheets by using the same procedure.
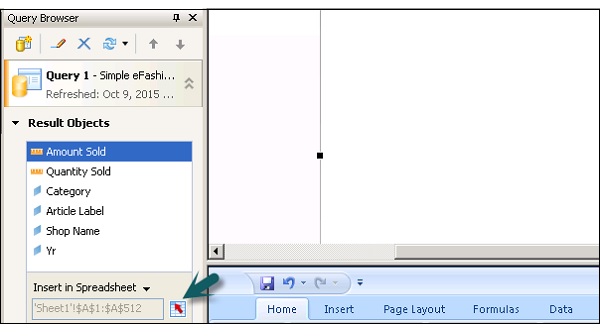
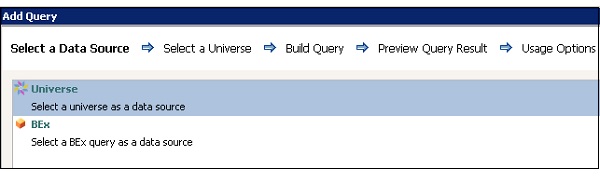
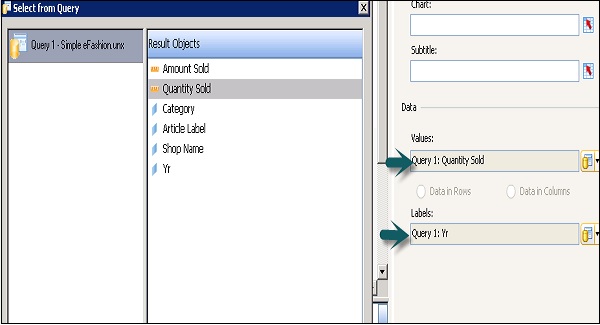
BEX Query or Universe Query
You can also use BEX query or Universe query as data source for different components in the model. You can select result objects from query to bind to the components. In many scenarios, it is not possible to bind query objects to component parameters.
You can also use a few components to write the data to query objects.
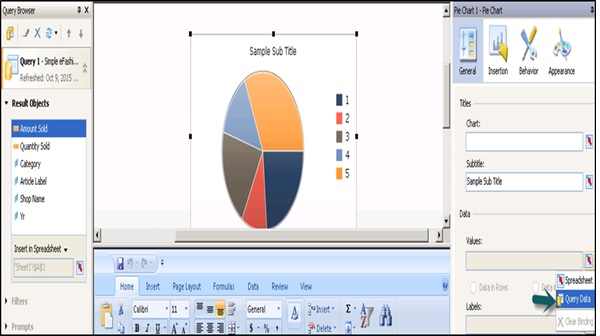
To clear the binding from a chart, you can select Clear Binding from the list as shown in the following screenshot.
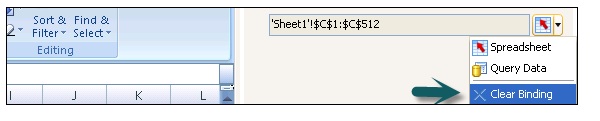
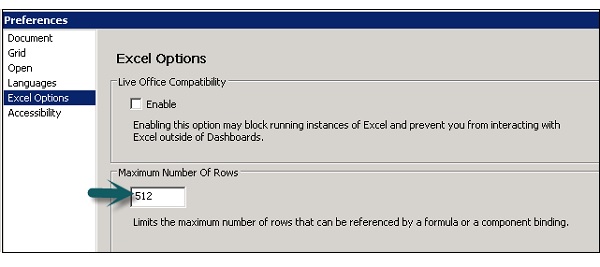
Note − You can select a maximum range of 512 rows in a range. Larger the value, slower the performance of the data model. To change this value, go to File → Preferences → Excel Options.