- JIRA - Home
- JIRA - Overview
- JIRA - Project
- JIRA - Issues
- JIRA - Workflow
- JIRA - Installation
- JIRA - Free Trials Setup
- JIRA - Login
- JIRA - Dashboard
- JIRA - Issue Types
- JIRA - Screens
- JIRA - Issue Creation
- JIRA - Clone an Issue
- JIRA - Create a Subtask
- JIRA - Convert Issue To Subtask
- JIRA - Convert Subtask to Issue
- JIRA - Create Issue using CSV
- JIRA - Edit an Issue
- JIRA - Email an Issue
- JIRA - Label an Issue
- JIRA - Linking Issues
- JIRA - Move an Issue
- JIRA - View/Change History
- JIRA - Watch and Vote on Issue
- JIRA - Search
- JIRA - Advanced Search
- JIRA - Reports
- JIRA - Workload Pie Chart
- JIRA - Created vs Resolved Issues
- JIRA - Burndown Chart
JIRA - Workload Pie Chart
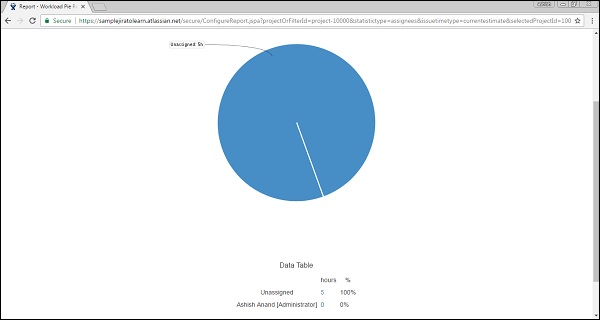
A workload pie chart displays a pie chart showing all the issues for a specific project. Let us understand how to use it in JIRA.
Generate a Report
To generate a report, the user should follow the steps given below.
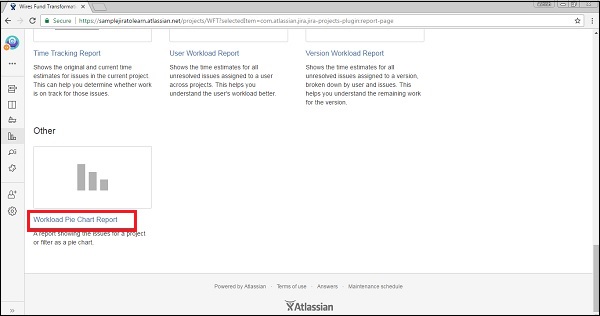
Step 1 − Go to Project → choose the Specific project. Click on the Report icon on the left side of the menu. Go to Others section and click on Workload Pie Chart Report as shown in the following screenshot.
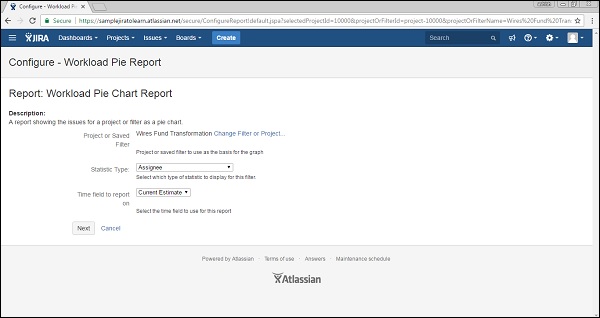
Step 2 − Select Project or issue filter for which to generate the report. In the Statistic Type, select the field name on which the pie chart will be formed. Select the Time Field to report on as Current Estimate, Original Estimate or Time Spent.
The following screenshot shows how to generate a report by providing details.
Step 3 − Click on Next to generate the report. The following screenshot shows how the generated report looks like.