- JIRA - Home
- JIRA - Overview
- JIRA - Project
- JIRA - Issues
- JIRA - Workflow
- JIRA - Installation
- JIRA - Free Trials Setup
- JIRA - Login
- JIRA - Dashboard
- JIRA - Issue Types
- JIRA - Screens
- JIRA - Issue Creation
- JIRA - Clone an Issue
- JIRA - Create a Subtask
- JIRA - Convert Issue To Subtask
- JIRA - Convert Subtask to Issue
- JIRA - Create Issue using CSV
- JIRA - Edit an Issue
- JIRA - Email an Issue
- JIRA - Label an Issue
- JIRA - Linking Issues
- JIRA - Move an Issue
- JIRA - View/Change History
- JIRA - Watch and Vote on Issue
- JIRA - Search
- JIRA - Advanced Search
- JIRA - Reports
- JIRA - Workload Pie Chart
- JIRA - Created vs Resolved Issues
- JIRA - Burndown Chart
JIRA - Burndown Chart
It displays the total work remaining to achieve the sprint goal for a given time to sprint. It helps the team to manage the progress and respond accordingly. This chart is an important feature of Agile Scrum methodology.
Generate a Report
To generate a report, the user should follow the steps given below.
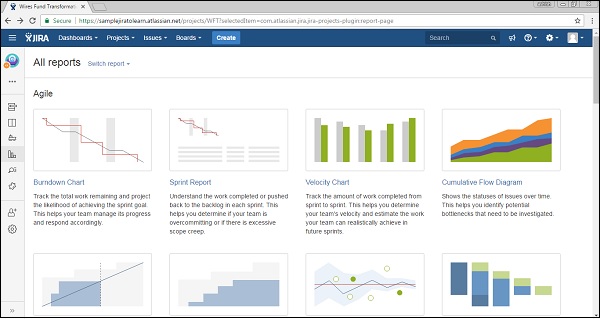
Step 1 − Go to Project → choose a Specific project. Click on the Report icon on the left side of the menu. Go to Agile and click on Burndown chart. The following screenshot shows how to access a Burndown Chart.
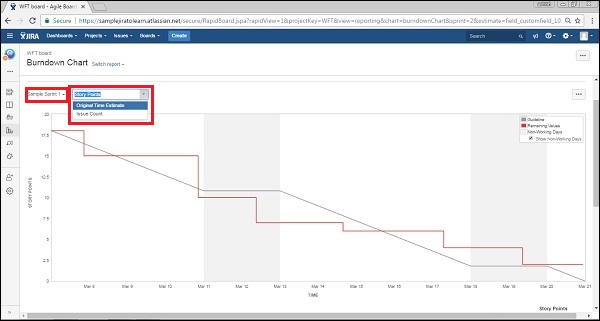
Step 2 − It displays the Burndown chart of the sprint like how the team is progressing towards a committed task. The red line displays how much work is remaining, while the grey line shows the committed tasks. The team can see where they stand in terms of the progress of sprint as compared to the commitment at the starting of that sprint. The user can change the Sprint and Y-axis by selection from a dropdown.
The following screenshot shows how the Burndown chart looks like sprint wise.
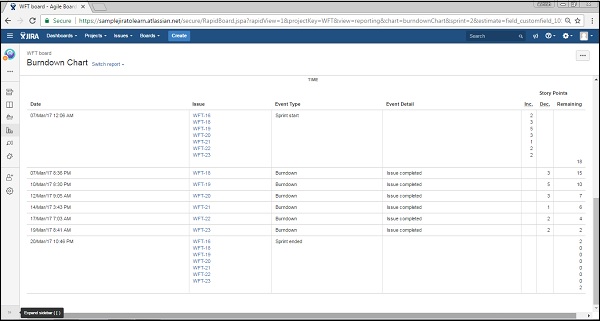
Step 3 − In the second part of the report, it displays data like what is the sprint start date, what all issues were added, day by day how many issues resolved, what story points of the issues are, and day-by-day how many story points are remaining. This data is utilized to create the chart. The following screenshot shows the data that is used to generate the chart.
Note − Quite similar to these reports, other reports can also be generated.
