- JIRA - Home
- JIRA - Overview
- JIRA - Project
- JIRA - Issues
- JIRA - Workflow
- JIRA - Installation
- JIRA - Free Trials Setup
- JIRA - Login
- JIRA - Dashboard
- JIRA - Issue Types
- JIRA - Screens
- JIRA - Issue Creation
- JIRA - Clone an Issue
- JIRA - Create a Subtask
- JIRA - Convert Issue To Subtask
- JIRA - Convert Subtask to Issue
- JIRA - Create Issue using CSV
- JIRA - Edit an Issue
- JIRA - Email an Issue
- JIRA - Label an Issue
- JIRA - Linking Issues
- JIRA - Move an Issue
- JIRA - View/Change History
- JIRA - Watch and Vote on Issue
- JIRA - Search
- JIRA - Advanced Search
- JIRA - Reports
- JIRA - Workload Pie Chart
- JIRA - Created vs Resolved Issues
- JIRA - Burndown Chart
JIRA - Reports
JIRA provides different types of reports within a project. It helps to analyze the Progress, Issues, Showstoppers and Timeliness of any Project. It also helps to analyze the resource utilization as well.
How to Access Reports
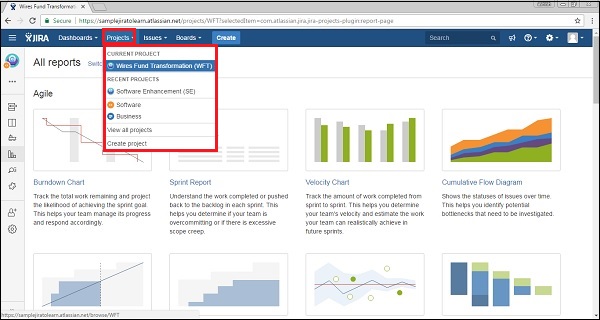
To access reports in JIRA, the user should go to Project → choose Specific project. The following screenshot shows how to navigate to a specific project.
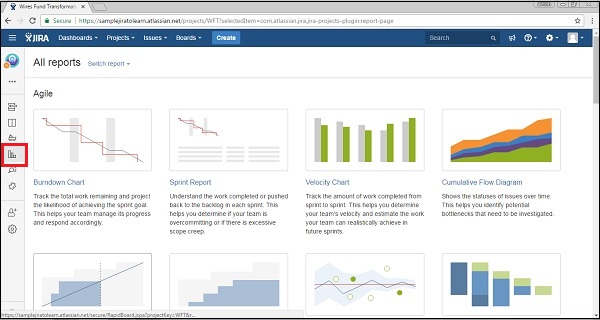
Click on the Reports icon on the left side of the page. It will display all the reports supported by JIRA. The following screenshot shows how to access the Report section.
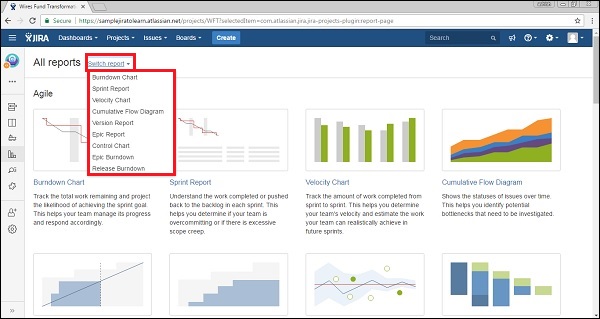
When the user clicks on Switch report, it will display the list of reports. The following screenshot shows list of reports available for quick switch.
Type of Reports
JIRA has categorized reports in four levels, which are −
- Agile
- Issue Analysis
- Forecast & Management
- Others
Let us now discuss the features of the above-mentioned report categories in detail.
Agile
Following are the list of features of Agile Reports.
Burn down Chart − Track the total work remaining, also whether sprint is achieving the project goal or not.
Sprint Chart − Track the work completed or pushed back to the backlog in each sprint.
Velocity Chart − Track the amount of work completed from sprint to sprint.
Cumulative Flow Diagram − Shows the statuses of issues over time. It helps to identify high-risk issues or unresolved important issues.
Version Report − Track the projected release date for a version.
Epic Report − Shows the progress towards completing an epic over a given time.
Control Chart − Shows the cycle time for the product, its version or the sprint. It helps to identify whether data from the current process can be used to determine future performance.
Epic Burn Down − Track the projected number of sprints required to complete the epic.
Release Burn Down − Track the projected release date for a version. It helps to monitor whether the version will release on time, so mandatory action can be taken if work is falling behind.
Issue Analysis
Following are the list of features of Issue Analysis.
Average Age Report − Displays the average age in days of unresolved issues.
Created Vs Resolved Issue Report − Display the number of issues created vs the number of issues resolved in given period.
Pie chart Report − Shows a pie chart of issues for a project grouped by a specified field.
Recently Created Issue Report − Shows the number of issues created over a time-period for a project and how many of those were resolved.
Resolution Time Report − Displays the average time taken to resolve issues.
Single Level Group by Report − .It helps to group the search results by a field and see the overall status of each group.
Time since Issues Report − It helps to track how many issues were created, updated, resolved, etc., over a time-period.
Forecast & Management
Following are the list of features of Forecast and Management type of reports.
Time Tracking Report − Shows the original and current time estimates for issues in the current project. It can help to determine whether work is on track for those issues.
User Workload Report − Shows the time estimates for all unresolved issues assigned to a user across projects. It helps to understand how much a user is occupied, whether overburdened or has less work.
Version Workload Report − Displays how much outstanding work is remaining per user and per issue. It helps to understand the remaining work of a version.
In addition to these, there are other types of reports that generally have a pie chart in them, which we will discuss in detail in the subsequent chapters.
