- TestLink - Home
- TestLink – Introduction
- TestLink – Features
- TestLink – Installation
- TestLink – Login
- TestLink – Add a Project
- TestLink – Dashboard
- TestLink – Projects
- TestLink – Inventory
- TestLink – Test Plan
- TestLink – Build Management
- TestLink – Test Specification
- TestLink – Test Suite
- TestLink – Test Cases
- TestLink – Import Data
- TestLink – Export Data
- TestLink – Test Plan Relation
- TestLink – Search
- TestLink – Keywords
- Test Specification Document
- TestLink – Create Requirement
- TestLink – Requirement Overview
- TestLink – Assign Test Execution
- TestLink – Bulk User Assignment
- TestLink – Platforms
- TestLink – Milestones
- TestLink – Test Execution Setup
- TestLink – Test Execution
- TestLink – Reports & Metrics
- TestLink – Reports
- TestLink – Charts
Selected Reading
TestLink - Charts
This report requires graphic library installed on the web server. Last Test Result logic is used for all four charts.
To access the Charts, click the Charts on the left pane as shown below.
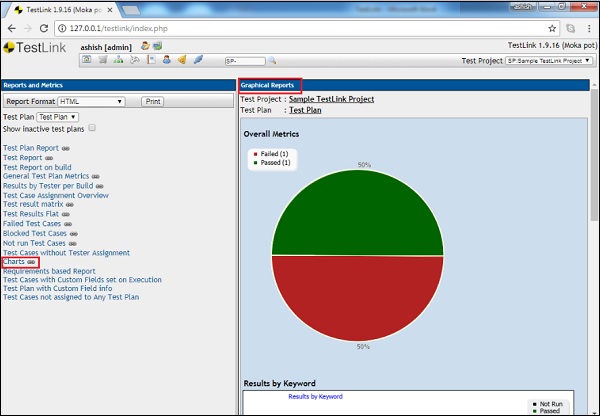
Report contains the following charts −
Pie chart of overall passed / failed / blocked / and not run Test Cases as shown above.
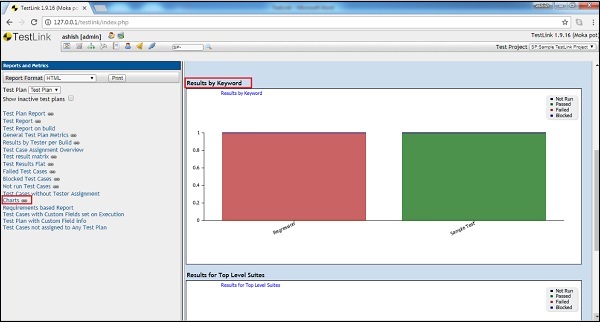
Bar chart of Results by Keyword as shown below.
Bar chart of Results by Top Level Suite as shown below.
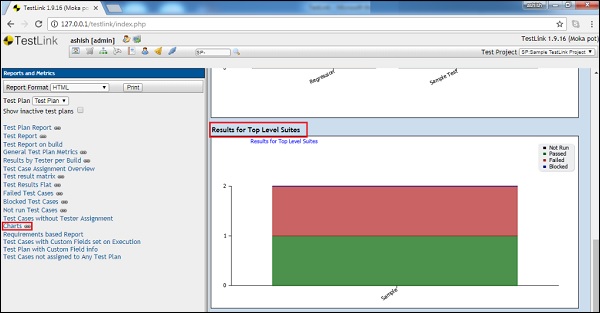
The bars in the bar charts are colored such that the user can identify the approximate number of passed, failed, blocked, and not run cases.

Advertisements