- React - Home
- React - Introduction
- React - Roadmap
- React - Installation
- React - Features
- React - Advantages & Disadvantages
- React - Architecture
- React - Creating a React Application
- React - JSX
- React - Components
- React - Nested Components
- React - Using Newly Created Components
- React - Component Collection
- React - Styling
- React - Properties (props)
- React - Creating Components using Properties
- React - props Validation
- React - Constructor
- React - Component Life Cycle
- React - Event management
- React - Creating an Event−Aware Component
- React - Introduce Events in Expense Manager APP
- React - State Management
- React - State Management API
- React - Stateless Component
- React - State Management Using React Hooks
- React - Component Life Cycle Using React Hooks
- React - Layout Component
- React - Pagination
- React - Material UI
- React - Http Server
- React - Http client programming
- React - Form Programming
- React - Forms
- React - Controlled Component
- React - Uncontrolled Component
- React - Formik
- React - Conditional Rendering
- React - Lists
- React - Keys
- React - Routing
- React - Redux
- React - Animation
- React - Bootstrap
- React - Map
- React - Table
- React - Managing State Using Flux
- React - Testing
- React - CLI Commands
- React - Building and Deployment
- React - Example
- Hooks
- React - Introduction to Hooks
- React - Using useState
- React - Using useEffect
- React - Using useContext
- React - Using useRef
- React - Using useReducer
- React - Using useCallback
- React - Using useMemo
- React - Custom Hooks
- React Advanced
- React - Accessibility
- React - Code Splitting
- React - Context
- React - Error Boundaries
- React - Forwarding Refs
- React - Fragments
- React - Higher Order Components
- React - Integrating With Other Libraries
- React - Optimizing Performance
- React - Profiler API
- React - Portals
- React - React Without ES6 ECMAScript
- React - React Without JSX
- React - Reconciliation
- React - Refs and the DOM
- React - Render Props
- React - Static Type Checking
- React - Strict Mode
- React - Web Components
- Additional Concepts
- React - Date Picker
- React - Helmet
- React - Inline Style
- React - PropTypes
- React - BrowserRouter
- React - DOM
- React - Carousel
- React - Icons
- React - Form Components
- React - Reference API
- React Useful Resources
- React - Quick Guide
- React - Cheatsheet
- React - Axios CheatSheet
- React - Useful Resources
- React - Discussion
React - Profiler API
Profiling is an important technique to collect and show the time taken for a specific function to execute in the live environment. Profiling is normally use to find the performance bottleneck in a application. React provides two option to profile a react application
Profiler Component
Profiler DevTools
Profiler Component
React profiler component is just another react component used to record the profile information of a react component. Profiler component can be used anywhere in the react element tree. React accepts multiple profiler and multi-level nesting of the profiler. Let us check the signature and how to apply profiler in a react application in this chapter.
Signature of the Profiler component
Profiler component can nest any react component and requires two props,
id
Identifier for the profiler component
onRender callback function
Callback function called during each phase of the component rendering
The signature of the callback function is as follows −
function onRenderCallback(
   id,
   phase,
   actualDuration,
   baseDuration,
   startTime,
   commitTime,
   interactions
){
   // Do anything with the profiler information
}
An example callback function implementation to log the profiling data in the console is as follows −
const logProfilerData = (id, phase, actualTime, baseTime, startTime, commitTime) => {
   console.log(`${id}'s ${phase} phase:`);
   console.log(`Actual time: ${actualTime}`);
   console.log(`Base time: ${baseTime}`);
   console.log(`Start time: ${startTime}`);
   console.log(`Commit time: ${commitTime}`);
};
Applying Profiler
Let us create a new react application to learn how to apply Profiler component in this section.
First of all, create a new react application and start it using below command.
create-react-app myapp
cd myapp
npm start
Next, open App.css (src/App.css) and remove all CSS classes.
// remove all css classes
Hello.js
Next, create a simple hello component, Hello (src/components/Hello.js) and render a simple message as shown below −
import React from "react";
class Hello extends React.Component {
   constructor(props) {
      super(props)
   }
   render() {
      return (
         <div>Hello, {this.props.name}</div>
      );
   }
}
export default Hello;
Here,
Used name props to render the hello message with the given name
App.js
Next, open App component (src/App.js), and use profiler component as shown below −
import './App.css'
import React, { Profiler } from 'react';
import Hello from './components/Hello'
const logProfilerData = (id, phase, actualTime, baseTime, startTime, commitTime) => {
   console.log(`${id}'s ${phase} phase:`);
   console.log(`Actual time: ${actualTime}`);
   console.log(`Base time: ${baseTime}`);
   console.log(`Start time: ${startTime}`);
   console.log(`Commit time: ${commitTime}`);
};
function App() {
   return (
      <div className="container">
         <div style={{ padding: "10px" }}>
            <div>
               <Profiler id="helloWorld" onRender={logProfilerData}>
                  <Hello name="World" />
               </Profiler>
            </div>
         </div>
      </div>
   );
}
export default App;
Here,
Imported Profiler component from the react package
Used Hello component by wrapping it with Profiler component
Created a callback function, logProfilerData and emitted all profiler data into the console
Set the logProfilerData callback function in onRender props of Profiler component
Finally, open the application in the browser and check the final result. It will render the hello component as shown below −
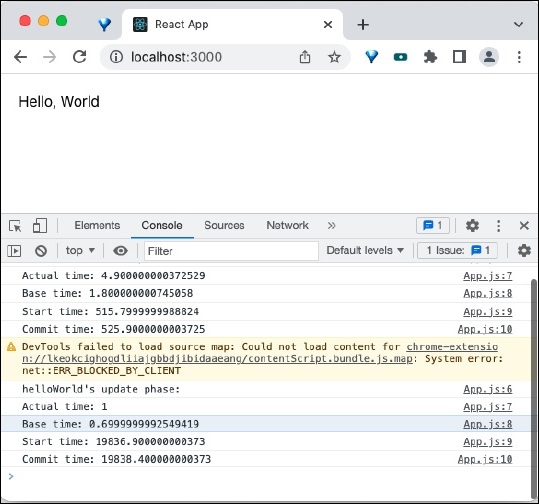
Open the console and you can see the profiler information as shown below −
helloWorld's mount phase:
App.js:7 Actual time: 4.900000000372529
App.js:8 Base time: 1.800000000745058
App.js:9 Start time: 515.7999999988824
App.js:10 Commit time: 525.9000000003725
...
App.js:6 helloWorld's update phase:
App.js:7 Actual time: 1
App.js:8 Base time: 0.6999999992549419
App.js:9 Start time: 19836.900000000373
App.js:10 Commit time: 19838.400000000373
Profiler React DevTools
React DevTools plugin introduced a separate section for profiler. Developer can open the Profiler tab and get lot of useful insight about the application. Some of the feature available in profiler DevTools are as follows −
Browsing commits
Filtering commits
Flame chart
Ranked chart
Component chart
Conclusion
React profiler component and profiler devtools are indispensible and powerful tools to profile and optimize a react application.
