- MicroStrategy - Home
- MicroStrategy - Overview
- MicroStrategy - Environment Setup
- MicroStrategy - Desktop
- MicroStrategy - Architecture
- MicroStrategy - Importing Data
- MicroStrategy - OLAP Services
- Configuration Objects
- MicroStrategy - Public Objects
- MicroStrategy - Schema Objects
- MicroStrategy - Report Objects
- MicroStrategy Basic Reporting
- MicroStrategy - Report Types
- MicroStrategy - Slicing
- MicroStrategy - Dicing
- MicroStrategy - Pivoting
- MicroStrategy - Drilldown
- MicroStrategy - Rollup
- MicroStrategy - Creating Metrics
- MicroStrategy - Nested Metrics
- MicroStrategy Advanced Reporting
- Creating Derived Metrics
- MicroStrategy - Metric Comparison
- MicroStrategy - Creating Filters
- MicroStrategy - Advanced Filters
- Shortcut & Embedded Filters
- MicroStrategy - Refreshing Reports
- MicroStrategy - Intelligent Cubes
- MicroStrategy Dashboards
- Creating a Dashboard
- Formatting a Dashboard
- MicroStrategy - Graph Visualizations
- MicroStrategy - Grid Visualizations
- Heat Map Visualization
- MicroStrategy - N/W Visualization
- Visualization with Multiple Datasets
- Filtering Data in Dashboard
- MicroStrategy - Adding Web Content
- MicroStrategy Office
- Conditional Formatting
- MicroStrategy - Custom Groups
- MicroStrategy - Report Cache Flow
- MicroStrategy - Data Marts
- MicroStrategy - Predictive Models
- MicroStrategy Useful Resources
- MicroStrategy - Quick Guide
- MicroStrategy - Useful Resources
- MicroStrategy - Discussion
MicroStrategy - Report Types
The reports created in MicroStrategy can be seen from a different prospective. Some can be seen as only numbers and text, while some other only as graphs. We can also combine the textual and graphical visualizations together.
The reports created in MicroStrategy can be seen from a different prospective. Some can be seen as only numbers and text. While some other only as graphs. We can also combine the textual and graphical visualizations together.
Following are the three report types used in MicroStrategy Desktop.
Grid Reports − These reports display only textual information in the form of grids showing rows and columns of data.
Graph Reports − These reports show various graphs created from the data sets.
Combined Reports − These reports can show the combination of both the Grid and Graphical reports.
Lets discuss these types of reports in detail.
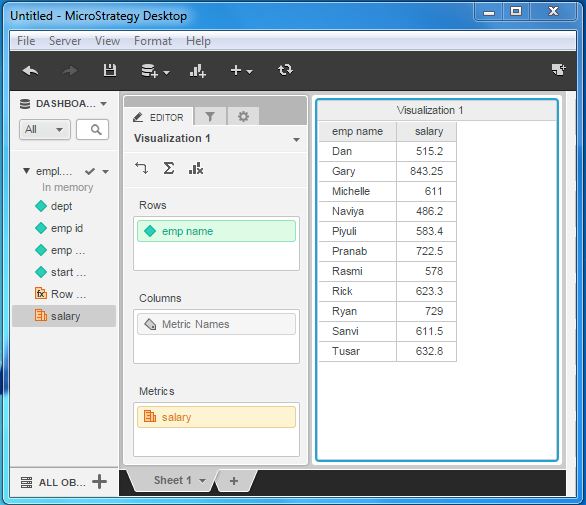
Grid Reports
Consider the report created from the employee data earlier. As we display only the textual information showing the employee ID and salary for each of the departments, it is an example of a grid report.
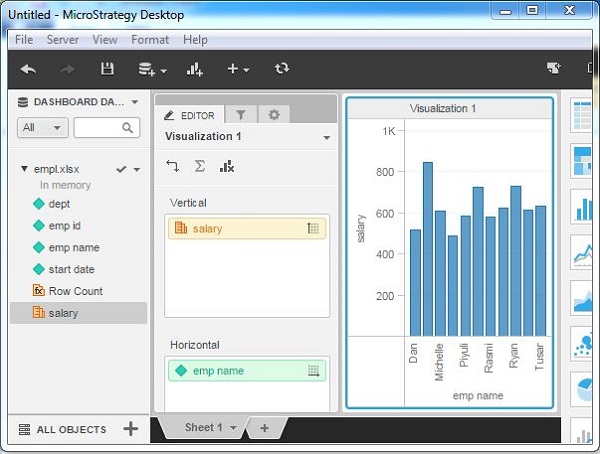
Graph Reports
We can choose an appropriate graphical visualization of the data from the gallery of visualizations available in MicroStrategy. In the following screenshot, we see the bar chart graph created for the above data set by simply clicking the bar chart visualization available in the right pane.
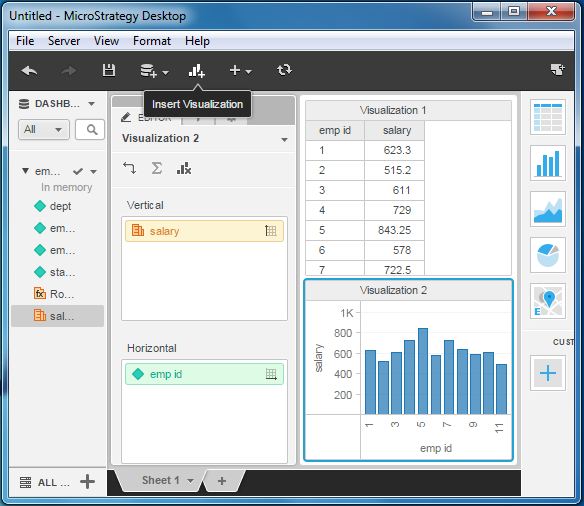
Combination Graph
We can combine both the grid and graph charts by adding both the types of visualizations on one screen.