- MicroStrategy - Home
- MicroStrategy - Overview
- MicroStrategy - Environment Setup
- MicroStrategy - Desktop
- MicroStrategy - Architecture
- MicroStrategy - Importing Data
- MicroStrategy - OLAP Services
- Configuration Objects
- MicroStrategy - Public Objects
- MicroStrategy - Schema Objects
- MicroStrategy - Report Objects
- MicroStrategy Basic Reporting
- MicroStrategy - Report Types
- MicroStrategy - Slicing
- MicroStrategy - Dicing
- MicroStrategy - Pivoting
- MicroStrategy - Drilldown
- MicroStrategy - Rollup
- MicroStrategy - Creating Metrics
- MicroStrategy - Nested Metrics
- MicroStrategy Advanced Reporting
- Creating Derived Metrics
- MicroStrategy - Metric Comparison
- MicroStrategy - Creating Filters
- MicroStrategy - Advanced Filters
- Shortcut & Embedded Filters
- MicroStrategy - Refreshing Reports
- MicroStrategy - Intelligent Cubes
- MicroStrategy Dashboards
- Creating a Dashboard
- Formatting a Dashboard
- MicroStrategy - Graph Visualizations
- MicroStrategy - Grid Visualizations
- Heat Map Visualization
- MicroStrategy - N/W Visualization
- Visualization with Multiple Datasets
- Filtering Data in Dashboard
- MicroStrategy - Adding Web Content
- MicroStrategy Office
- Conditional Formatting
- MicroStrategy - Custom Groups
- MicroStrategy - Report Cache Flow
- MicroStrategy - Data Marts
- MicroStrategy - Predictive Models
- MicroStrategy Useful Resources
- MicroStrategy - Quick Guide
- MicroStrategy - Useful Resources
- MicroStrategy - Discussion
MicroStrategy - Drilldown
Drilldown is the process of going down in a hierarchy of dimensions to get more granular values of the measures. In a data set with more than one dimension, which is linked to each other in an hierarchical fashion, we start with a dimension at the top and then gradually add more dimensions to get new granular values.
Drill-down options give more insight into how different values at each level get aggregated.
Example
In the all_slaes data set, lets consider the following 3 dimensions applied to the measure Sales.
- Product Line
- Category
- Subcategory
Following are the steps to perform a drill-down.
Step 1
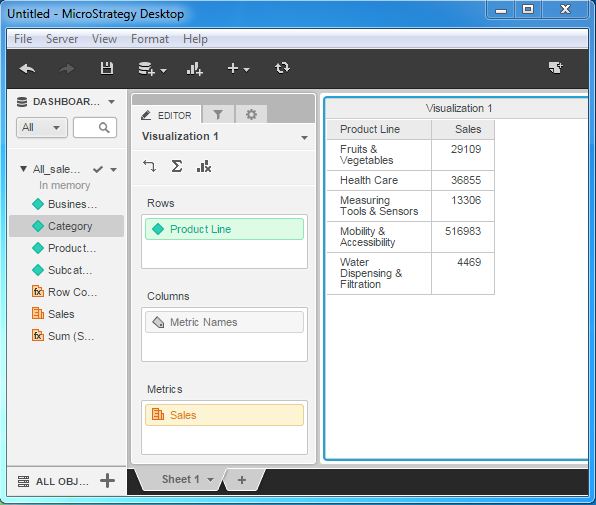
Create a visualization with dimension - product line and measure sales as shown in the following screenshot.
Step 2
Add the dimension category to the visualization below Product Line. As you can see the value of the sales column changes, reflecting the values for each category under the product line.
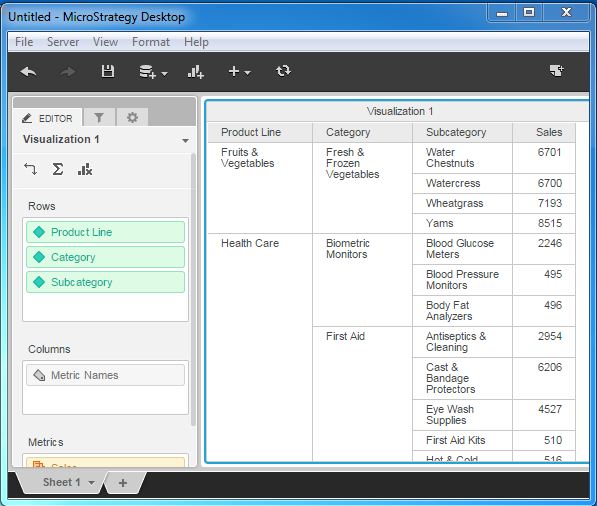
Step 3
Next, lets add the dimension sub-category below the dimension category and it further changes the values in the sales column.