- MicroStrategy - Home
- MicroStrategy - Overview
- MicroStrategy - Environment Setup
- MicroStrategy - Desktop
- MicroStrategy - Architecture
- MicroStrategy - Importing Data
- MicroStrategy - OLAP Services
- Configuration Objects
- MicroStrategy - Public Objects
- MicroStrategy - Schema Objects
- MicroStrategy - Report Objects
- MicroStrategy Basic Reporting
- MicroStrategy - Report Types
- MicroStrategy - Slicing
- MicroStrategy - Dicing
- MicroStrategy - Pivoting
- MicroStrategy - Drilldown
- MicroStrategy - Rollup
- MicroStrategy - Creating Metrics
- MicroStrategy - Nested Metrics
- MicroStrategy Advanced Reporting
- Creating Derived Metrics
- MicroStrategy - Metric Comparison
- MicroStrategy - Creating Filters
- MicroStrategy - Advanced Filters
- Shortcut & Embedded Filters
- MicroStrategy - Refreshing Reports
- MicroStrategy - Intelligent Cubes
- MicroStrategy Dashboards
- Creating a Dashboard
- Formatting a Dashboard
- MicroStrategy - Graph Visualizations
- MicroStrategy - Grid Visualizations
- Heat Map Visualization
- MicroStrategy - N/W Visualization
- Visualization with Multiple Datasets
- Filtering Data in Dashboard
- MicroStrategy - Adding Web Content
- MicroStrategy Office
- Conditional Formatting
- MicroStrategy - Custom Groups
- MicroStrategy - Report Cache Flow
- MicroStrategy - Data Marts
- MicroStrategy - Predictive Models
- MicroStrategy Useful Resources
- MicroStrategy - Quick Guide
- MicroStrategy - Useful Resources
- MicroStrategy - Discussion
MicroStrategy - Filtering Data in Dashboard
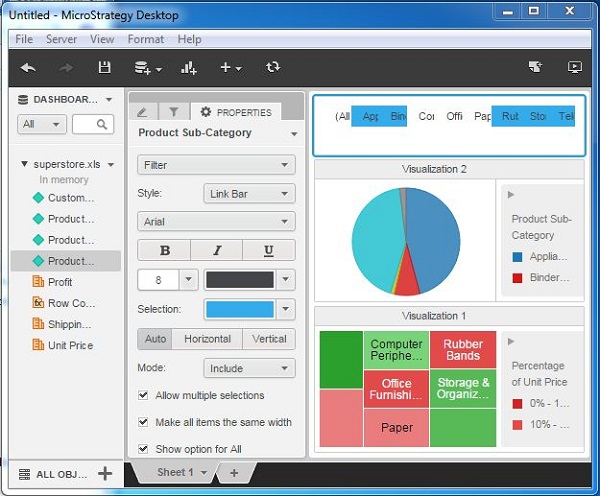
A dashboard is a document containing many visualizations displaying the results simultaneously. While carrying out data analysis, we may need to apply filter which will show the effect of the filter on each of the visualizations present in the dashboard. Also, all the results should have a synchronized value. This is possible by creating a normal filter and applying it to the dashboard.
Following is an example of applying a filter to the dashboard.
Step 1
Lets consider the dashboard which we created in the last chapter. Lets create a filter as shown in the following screenshot.
Step 2
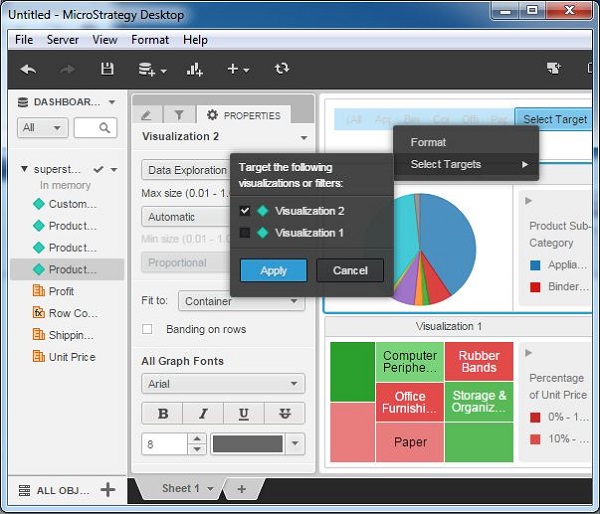
Click the Select Target option and apply the filter to visualization2. This will change the displayed values in visualization2, however visulaization1 will display a synchronized result.
Step 3
After applying the filter, click some of the values of the product category visible in the top bar filter section. This will change the diagrams, depending on the value selected. In the following example, we have selected multiple values and you can notice how the pie-chart changes as each of the values are selected.