- MicroStrategy - Home
- MicroStrategy - Overview
- MicroStrategy - Environment Setup
- MicroStrategy - Desktop
- MicroStrategy - Architecture
- MicroStrategy - Importing Data
- MicroStrategy - OLAP Services
- Configuration Objects
- MicroStrategy - Public Objects
- MicroStrategy - Schema Objects
- MicroStrategy - Report Objects
- MicroStrategy Basic Reporting
- MicroStrategy - Report Types
- MicroStrategy - Slicing
- MicroStrategy - Dicing
- MicroStrategy - Pivoting
- MicroStrategy - Drilldown
- MicroStrategy - Rollup
- MicroStrategy - Creating Metrics
- MicroStrategy - Nested Metrics
- MicroStrategy Advanced Reporting
- Creating Derived Metrics
- MicroStrategy - Metric Comparison
- MicroStrategy - Creating Filters
- MicroStrategy - Advanced Filters
- Shortcut & Embedded Filters
- MicroStrategy - Refreshing Reports
- MicroStrategy - Intelligent Cubes
- MicroStrategy Dashboards
- Creating a Dashboard
- Formatting a Dashboard
- MicroStrategy - Graph Visualizations
- MicroStrategy - Grid Visualizations
- Heat Map Visualization
- MicroStrategy - N/W Visualization
- Visualization with Multiple Datasets
- Filtering Data in Dashboard
- MicroStrategy - Adding Web Content
- MicroStrategy Office
- Conditional Formatting
- MicroStrategy - Custom Groups
- MicroStrategy - Report Cache Flow
- MicroStrategy - Data Marts
- MicroStrategy - Predictive Models
- MicroStrategy Useful Resources
- MicroStrategy - Quick Guide
- MicroStrategy - Useful Resources
- MicroStrategy - Discussion
MicroStrategy - Conditional Formatting
Conditional formatting in MicroStrategy involves highlighting parts of the visualization, which meets some pre-defined criteria in their values. Usually in case of metrics, we want to highlight the values which are greater than a certain percentage. There can also be examples of highlighting some category of product names, etc.
In MicroStrategy desktop, we can achieve this using the threshold feature. In this example, we will define the color to be used for highlighting certain values when a certain threshold is satisfied. Following are the steps.
Step 1
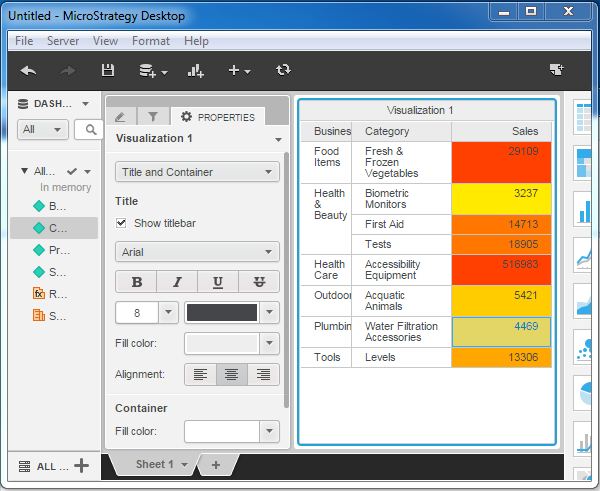
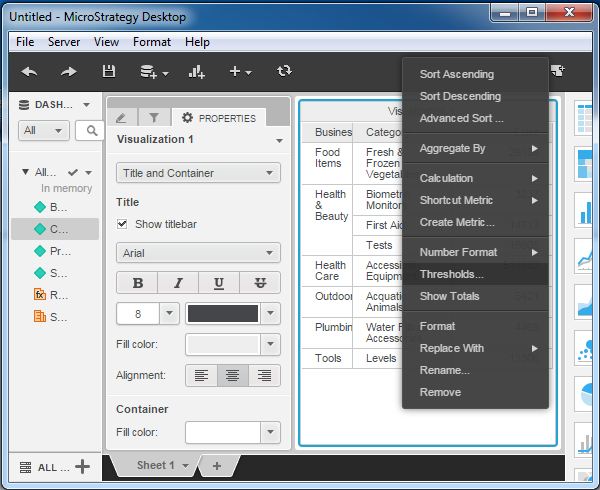
Create a grid report with the all_sales.xlsx as an example data set. Put the attributes Business line, Category in the grid along with the metric sales. Right-click the metric sales, and we get the option to choose the threshold as shown in the following screenshot.
Step 2
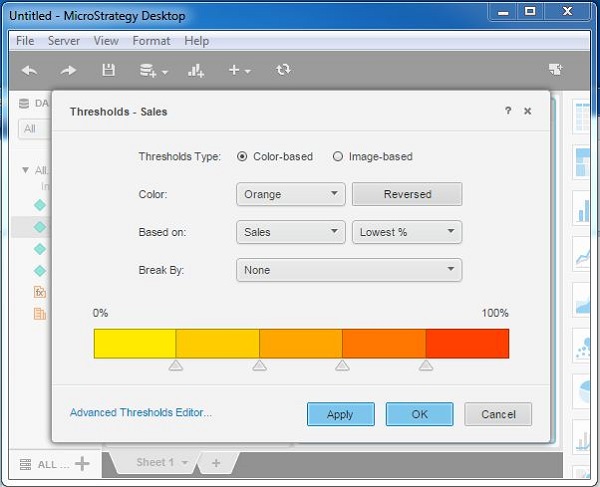
The following screenshot shows options to choose different colors based on the percentage value of sales.
Step 3
Finally, the result of applying the threshold is displayed in the following screenshot. In the metric Sales, the values are highlighted in different colors based on the percentage value of the sales as compared to the total sales.