- MicroStrategy - Home
- MicroStrategy - Overview
- MicroStrategy - Environment Setup
- MicroStrategy - Desktop
- MicroStrategy - Architecture
- MicroStrategy - Importing Data
- MicroStrategy - OLAP Services
- Configuration Objects
- MicroStrategy - Public Objects
- MicroStrategy - Schema Objects
- MicroStrategy - Report Objects
- MicroStrategy Basic Reporting
- MicroStrategy - Report Types
- MicroStrategy - Slicing
- MicroStrategy - Dicing
- MicroStrategy - Pivoting
- MicroStrategy - Drilldown
- MicroStrategy - Rollup
- MicroStrategy - Creating Metrics
- MicroStrategy - Nested Metrics
- MicroStrategy Advanced Reporting
- Creating Derived Metrics
- MicroStrategy - Metric Comparison
- MicroStrategy - Creating Filters
- MicroStrategy - Advanced Filters
- Shortcut & Embedded Filters
- MicroStrategy - Refreshing Reports
- MicroStrategy - Intelligent Cubes
- MicroStrategy Dashboards
- Creating a Dashboard
- Formatting a Dashboard
- MicroStrategy - Graph Visualizations
- MicroStrategy - Grid Visualizations
- Heat Map Visualization
- MicroStrategy - N/W Visualization
- Visualization with Multiple Datasets
- Filtering Data in Dashboard
- MicroStrategy - Adding Web Content
- MicroStrategy Office
- Conditional Formatting
- MicroStrategy - Custom Groups
- MicroStrategy - Report Cache Flow
- MicroStrategy - Data Marts
- MicroStrategy - Predictive Models
- MicroStrategy Useful Resources
- MicroStrategy - Quick Guide
- MicroStrategy - Useful Resources
- MicroStrategy - Discussion
MicroStrategy - Desktop
The MicroStrategy Desktop environment is very intuitive. It has a simple menu to import data for analysis and export the result of analysis. The menu also provides features to connect to a server if required, view the data sets available, the visualization gallery, and data filtering options, etc.
Desktop Windows
Following screenshot shows the image of MicroStrategy desktop windows.
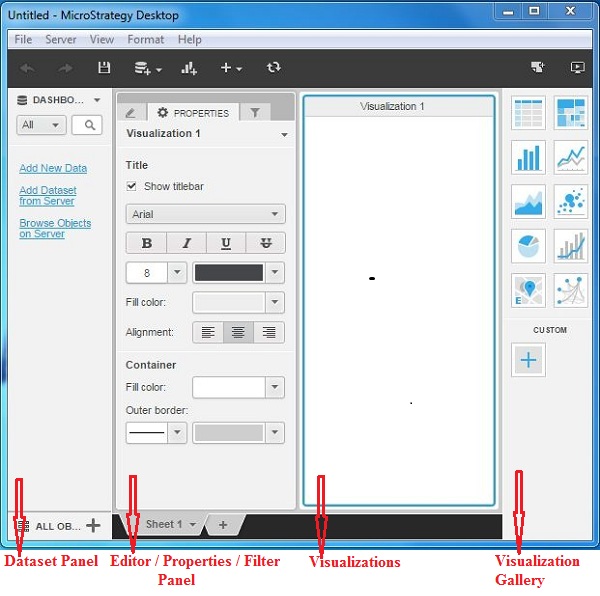
Following is a brief description of each of these windows.
Dataset Panel − This is used to add the required data sets to be analyzed. The data sets can come from any of the compatible sources. This section also gives an option to connect to the data sets available in MicroStrategy server.
Editor Panel − This is used to bring in the required rows and columns from the data set for analysis. Also the different matrices or mathematical expressions can be applied to the data analysis available here.
Properties Panel − This panel is used to set the display formats of the data such as font size, color alignment. etc.
Filter Panel − This panel is used to apply various filters on the data sets being analyzed.
Visualizations − It is the panel which shows data analysis. You can drag the data objects to this panel and apply a method of visualization to see the results.
Visualization Gallery − This panel displays the inbuilt-visualizations available, which can be applied directly on the data set. The various visualizations available are Heat maps, bar charts, bubble charts, network diagrams, etc. It also allows to create custom visualizations.
