- MicroStrategy - Home
- MicroStrategy - Overview
- MicroStrategy - Environment Setup
- MicroStrategy - Desktop
- MicroStrategy - Architecture
- MicroStrategy - Importing Data
- MicroStrategy - OLAP Services
- Configuration Objects
- MicroStrategy - Public Objects
- MicroStrategy - Schema Objects
- MicroStrategy - Report Objects
- MicroStrategy Basic Reporting
- MicroStrategy - Report Types
- MicroStrategy - Slicing
- MicroStrategy - Dicing
- MicroStrategy - Pivoting
- MicroStrategy - Drilldown
- MicroStrategy - Rollup
- MicroStrategy - Creating Metrics
- MicroStrategy - Nested Metrics
- MicroStrategy Advanced Reporting
- Creating Derived Metrics
- MicroStrategy - Metric Comparison
- MicroStrategy - Creating Filters
- MicroStrategy - Advanced Filters
- Shortcut & Embedded Filters
- MicroStrategy - Refreshing Reports
- MicroStrategy - Intelligent Cubes
- MicroStrategy Dashboards
- Creating a Dashboard
- Formatting a Dashboard
- MicroStrategy - Graph Visualizations
- MicroStrategy - Grid Visualizations
- Heat Map Visualization
- MicroStrategy - N/W Visualization
- Visualization with Multiple Datasets
- Filtering Data in Dashboard
- MicroStrategy - Adding Web Content
- MicroStrategy Office
- Conditional Formatting
- MicroStrategy - Custom Groups
- MicroStrategy - Report Cache Flow
- MicroStrategy - Data Marts
- MicroStrategy - Predictive Models
- MicroStrategy Useful Resources
- MicroStrategy - Quick Guide
- MicroStrategy - Useful Resources
- MicroStrategy - Discussion
MicroStrategy - Grid Visualizations
Grid Visualization is the simplest form of visualization in MicroStrategy, yet a very powerful analysis method. Here, data is presented as a grid with rows and columns as well as headers of the columns. It provides features such as sorting and drilling the data.
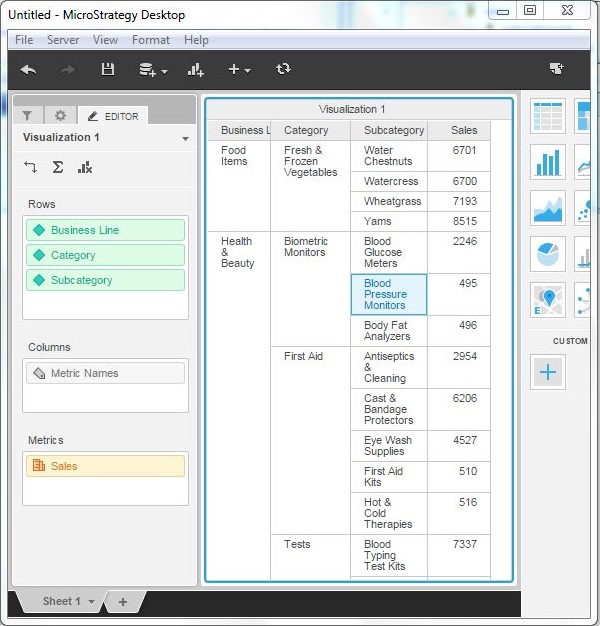
Creating a Grid Visualization
After loading the required data set into the MicroStrategy Environment, we pull the required fields to the editor panel. This automatically creates the Grid visualization. In the following example as shown, we pull the relevant fields from the data set and create a grid.
Operations in Grid Visualization
Following operations can be carried out in a grid visualization.
- Sorting data on multiple columns
- Swapping column and rows
- Drill on an attribute
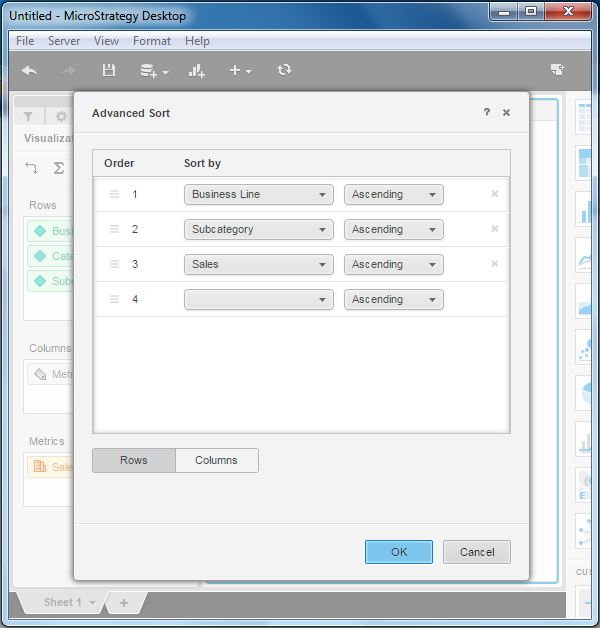
Sorting Data on Multiple Columns
Grid visualization provides a facility to sort on multiple columns simultaneously. Right-click on a column name and choose the option advanced sort. This brings us to a screen where we can select all the columns and their order to do the sorting.
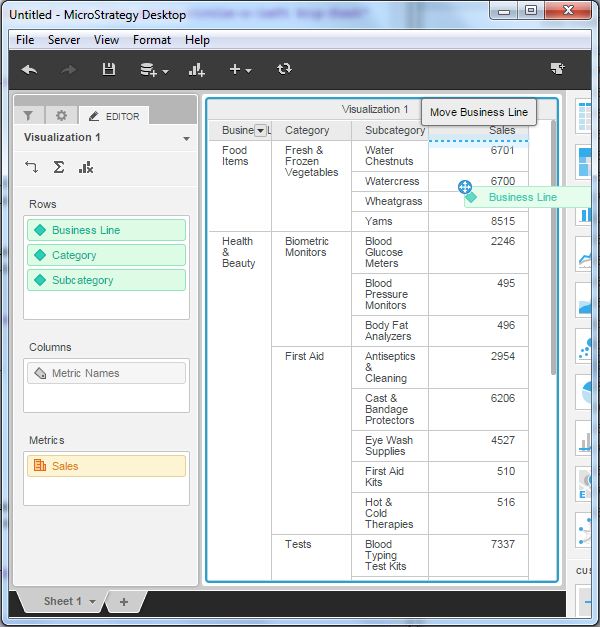
Swapping Column and Rows
We can swap the columns and rows in the grid visualization to make a pivot report. Just drag and drop the columns into rows as shown in the following screenshot.
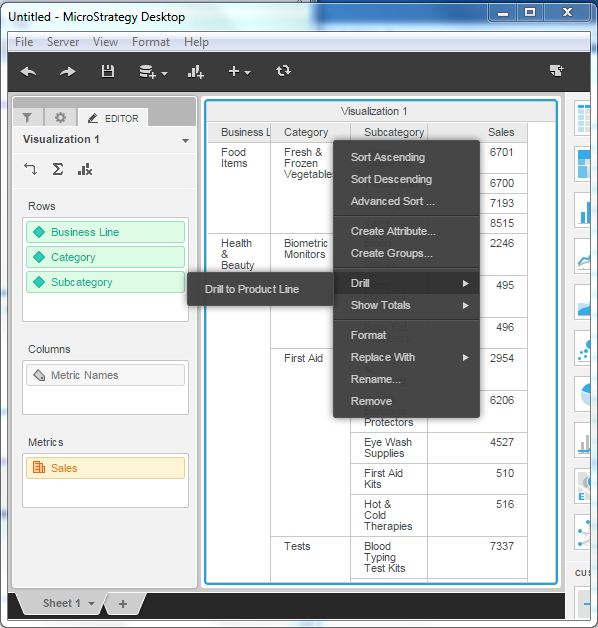
Drill on an Attribute
We can drill on an attribute on the grid visualization to get down to the values of the next attribute in the hierarchy. Right-click the column name and choose the drill option as shown in the following screenshot.