- MicroStrategy - Home
- MicroStrategy - Overview
- MicroStrategy - Environment Setup
- MicroStrategy - Desktop
- MicroStrategy - Architecture
- MicroStrategy - Importing Data
- MicroStrategy - OLAP Services
- Configuration Objects
- MicroStrategy - Public Objects
- MicroStrategy - Schema Objects
- MicroStrategy - Report Objects
- MicroStrategy Basic Reporting
- MicroStrategy - Report Types
- MicroStrategy - Slicing
- MicroStrategy - Dicing
- MicroStrategy - Pivoting
- MicroStrategy - Drilldown
- MicroStrategy - Rollup
- MicroStrategy - Creating Metrics
- MicroStrategy - Nested Metrics
- MicroStrategy Advanced Reporting
- Creating Derived Metrics
- MicroStrategy - Metric Comparison
- MicroStrategy - Creating Filters
- MicroStrategy - Advanced Filters
- Shortcut & Embedded Filters
- MicroStrategy - Refreshing Reports
- MicroStrategy - Intelligent Cubes
- MicroStrategy Dashboards
- Creating a Dashboard
- Formatting a Dashboard
- MicroStrategy - Graph Visualizations
- MicroStrategy - Grid Visualizations
- Heat Map Visualization
- MicroStrategy - N/W Visualization
- Visualization with Multiple Datasets
- Filtering Data in Dashboard
- MicroStrategy - Adding Web Content
- MicroStrategy Office
- Conditional Formatting
- MicroStrategy - Custom Groups
- MicroStrategy - Report Cache Flow
- MicroStrategy - Data Marts
- MicroStrategy - Predictive Models
- MicroStrategy Useful Resources
- MicroStrategy - Quick Guide
- MicroStrategy - Useful Resources
- MicroStrategy - Discussion
MicroStrategy - Creating Filters
Filtering data is a very important part of data analysis and visualization. MicroStrategy Desktop provides a variety of options to filter data in a report. It has simple filters, which get the data based on the values selected by the user. It also has features to create complex features, which will filter out data based on the calculations.
In this chapter, we will learn the basic steps to create a filter on a column with non-numeric values.
Example
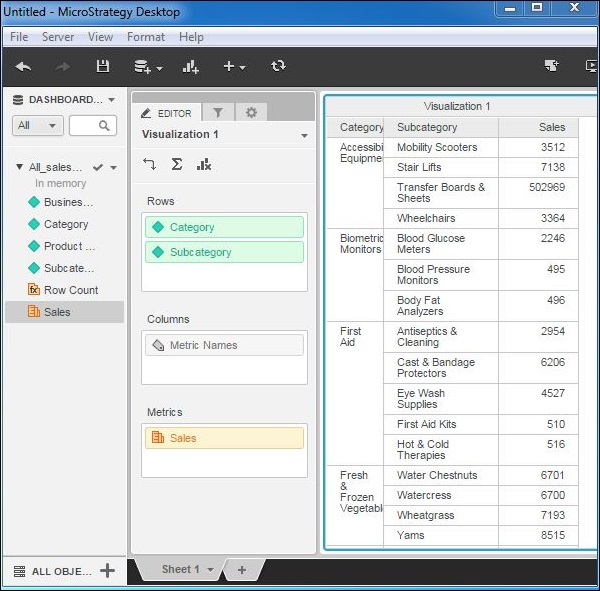
In this example, we aim to create a filter on the field subcategory in a grid report made up of the fields category, subcategory, and sales.
Step 1
Create a new visualization by choosing the fields category, subcategory as the rows and sales as the metric. The visualization is shown in the following screenshot.
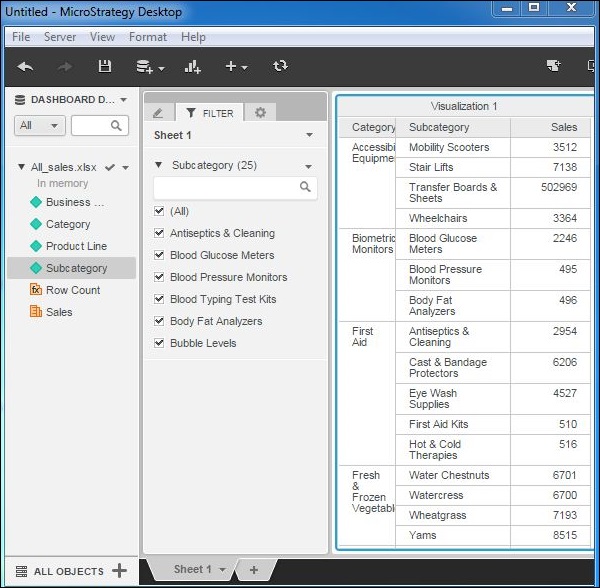
Step 2
Go to the Filter tab next to the Editor tab. Drag the field subcategory to this tab. It will automatically create a filter of type Dropdown as shown in the following screenshot. Also note that the number of values for this are shown in parentheses (25).
Step 3
Now check mark the specific values on which we want to filter out the results in the report. On checking these values, only the respective results are visible in the report.

