- MicroStrategy - Home
- MicroStrategy - Overview
- MicroStrategy - Environment Setup
- MicroStrategy - Desktop
- MicroStrategy - Architecture
- MicroStrategy - Importing Data
- MicroStrategy - OLAP Services
- Configuration Objects
- MicroStrategy - Public Objects
- MicroStrategy - Schema Objects
- MicroStrategy - Report Objects
- MicroStrategy Basic Reporting
- MicroStrategy - Report Types
- MicroStrategy - Slicing
- MicroStrategy - Dicing
- MicroStrategy - Pivoting
- MicroStrategy - Drilldown
- MicroStrategy - Rollup
- MicroStrategy - Creating Metrics
- MicroStrategy - Nested Metrics
- MicroStrategy Advanced Reporting
- Creating Derived Metrics
- MicroStrategy - Metric Comparison
- MicroStrategy - Creating Filters
- MicroStrategy - Advanced Filters
- Shortcut & Embedded Filters
- MicroStrategy - Refreshing Reports
- MicroStrategy - Intelligent Cubes
- MicroStrategy Dashboards
- Creating a Dashboard
- Formatting a Dashboard
- MicroStrategy - Graph Visualizations
- MicroStrategy - Grid Visualizations
- Heat Map Visualization
- MicroStrategy - N/W Visualization
- Visualization with Multiple Datasets
- Filtering Data in Dashboard
- MicroStrategy - Adding Web Content
- MicroStrategy Office
- Conditional Formatting
- MicroStrategy - Custom Groups
- MicroStrategy - Report Cache Flow
- MicroStrategy - Data Marts
- MicroStrategy - Predictive Models
- MicroStrategy Useful Resources
- MicroStrategy - Quick Guide
- MicroStrategy - Useful Resources
- MicroStrategy - Discussion
MicroStrategy - Report Objects
Each report in MicroStrategy is built using some underlying objects which represent the business scenario. These objects together represent the set of data requested by the report user and also the relationship between the various data elements.
To get the report objects of a report, open the report and click the report object icon as shown in the following screenshot.
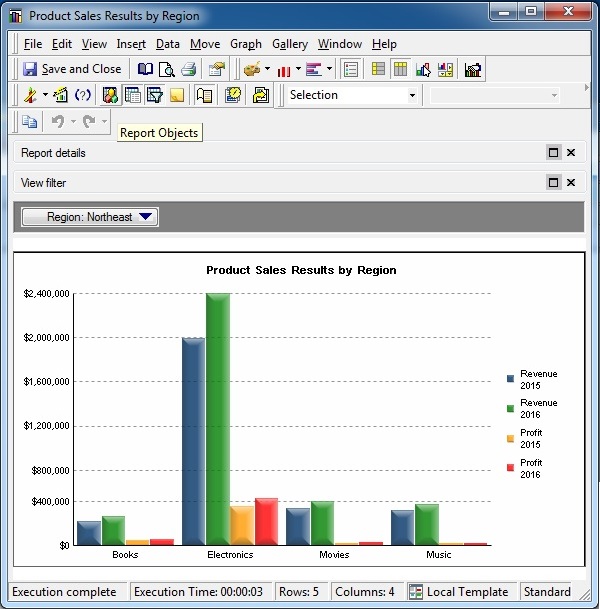
The above screenshot shows the report objects used in the report.
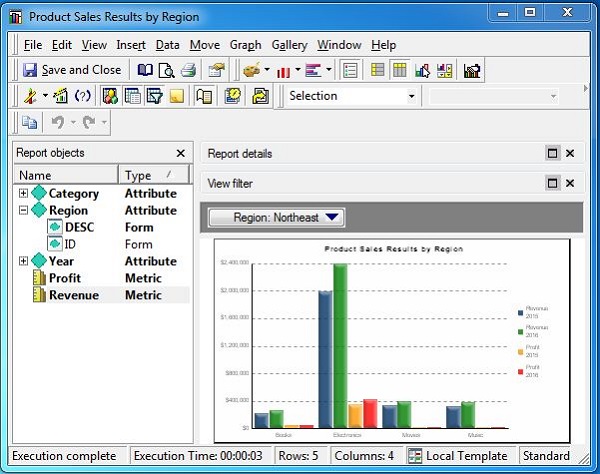
In the current example, we have three report objects −
Category − It is a report attribute showing the category of the products sold.
Region − It is a report attribute showing the region of the products sold.
Year − It is an attribute which contains two metric objects (profit and revenue).
Report Objects are very important from report design perspective as they decide which fields from the data source goes into the report and also the calculations applied on those fields.
