- MicroStrategy - Home
- MicroStrategy - Overview
- MicroStrategy - Environment Setup
- MicroStrategy - Desktop
- MicroStrategy - Architecture
- MicroStrategy - Importing Data
- MicroStrategy - OLAP Services
- Configuration Objects
- MicroStrategy - Public Objects
- MicroStrategy - Schema Objects
- MicroStrategy - Report Objects
- MicroStrategy Basic Reporting
- MicroStrategy - Report Types
- MicroStrategy - Slicing
- MicroStrategy - Dicing
- MicroStrategy - Pivoting
- MicroStrategy - Drilldown
- MicroStrategy - Rollup
- MicroStrategy - Creating Metrics
- MicroStrategy - Nested Metrics
- MicroStrategy Advanced Reporting
- Creating Derived Metrics
- MicroStrategy - Metric Comparison
- MicroStrategy - Creating Filters
- MicroStrategy - Advanced Filters
- Shortcut & Embedded Filters
- MicroStrategy - Refreshing Reports
- MicroStrategy - Intelligent Cubes
- MicroStrategy Dashboards
- Creating a Dashboard
- Formatting a Dashboard
- MicroStrategy - Graph Visualizations
- MicroStrategy - Grid Visualizations
- Heat Map Visualization
- MicroStrategy - N/W Visualization
- Visualization with Multiple Datasets
- Filtering Data in Dashboard
- MicroStrategy - Adding Web Content
- MicroStrategy Office
- Conditional Formatting
- MicroStrategy - Custom Groups
- MicroStrategy - Report Cache Flow
- MicroStrategy - Data Marts
- MicroStrategy - Predictive Models
- MicroStrategy Useful Resources
- MicroStrategy - Quick Guide
- MicroStrategy - Useful Resources
- MicroStrategy - Discussion
MicroStrategy - Dicing
The Dicing operation of a data set involves creating a smaller data set by fetching multiple values of one dimension with respect to one value from another dimension. For example, we get the values of sales for different subcategory of products with respect to one single category. Here, there is a hierarchical relationship between the category and sub-category of products.
Consider the data set superstore which contains the following dimensions −
- Customer segment
- Product category
- Product sub-category
- Profit
Following screenshots show the steps to dice the data with respect to the dimensions customer segment and product sub-category.
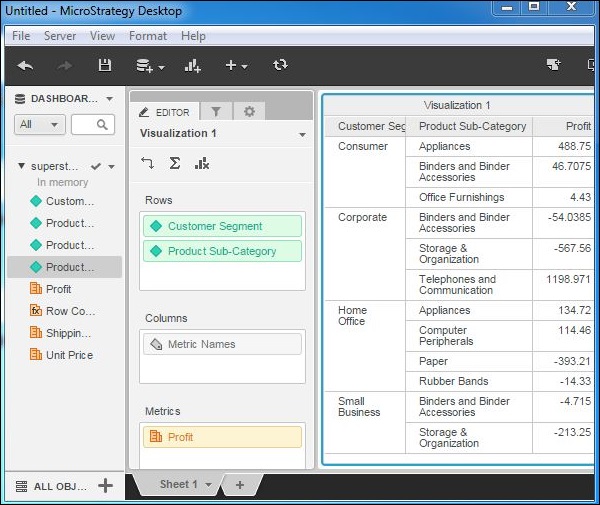
Step 1
Lets first create a grid report with the dimensions Customer segment and Product subcategory. We can also add the metric Profit.
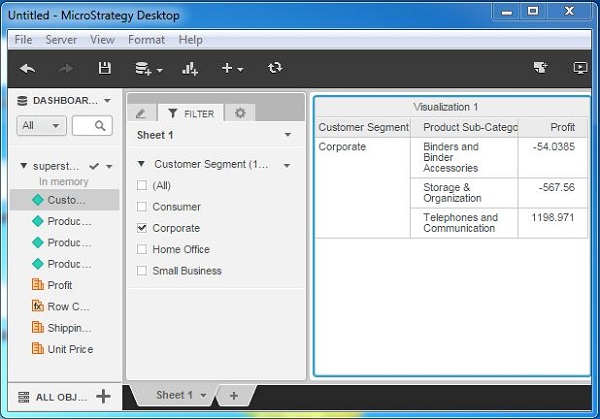
Step 2
Next, let's create a filter using the dimension customer segment. For this filter, we choose the value 'Customer segment'. However, we get the value of profit for all the values of sub-categories under this customer segment. Here, the data is diced across the subcategories for a given customer segment.