- Matplotlib Tutorial
- Matplotlib - Home
- Matplotlib - Introduction
- Matplotlib - Environment Setup
- Matplotlib - Anaconda distribution
- Matplotlib - Jupyter Notebook
- Matplotlib - Pyplot API
- Matplotlib - Simple Plot
- Matplotlib - PyLab module
- Object-oriented Interface
- Matplotlib - Figure Class
- Matplotlib - Axis Ranges
- Matplotlib - Axis Scales
- Matplotlib - Axis Ticks
- Matplotlib - Axes Class
- Matplotlib - Multiplots
- Matplotlib - Subplots() Function
- Matplotlib - Subplot2grid() Function
- Matplotlib - Anchored Artists
- Matplotlib - Coords Report
- Matplotlib - AGG Filter
- Matplotlib - Compound Path
- Matplotlib - Background Colors
- Matplotlib - Grids
- Matplotlib - Formatting Axes
- Matplotlib - Setting Limits
- Setting Ticks and Tick Labels
- Matplotlib - Twin Axes
- Matplotlib - Bar Plot
- Matplotlib - Histogram
- Matplotlib - Pie Chart
- Matplotlib - Scatter Plot
- Matplotlib - Contour Plot
- Matplotlib - Quiver Plot
- Matplotlib - Box Plot
- Matplotlib - Violin Plot
- Three-dimensional Plotting
- Matplotlib - 3D Contour Plot
- Matplotlib - 3D Wireframe plot
- Matplotlib - 3D Surface plot
- Matplotlib - Working With Text
- Mathematical Expressions
- Matplotlib - Working with Images
- Matplotlib - Transforms
- Matplotlib Useful Resources
- Matplotlib - Quick Guide
- Matplotlib - Useful Resources
- Matplotlib - Discussion
Matplotlib - Mathematical Expressions
In general, mathematical expressions are combinations of symbols that obey specific rules within a given mathematical context. These symbols can represent numbers, variables, operations, functions, and more. The structure of mathematical expressions follows rules that determine the order of operations and other aspects of logical syntax.
Following are a few examples of mathematical expressions −
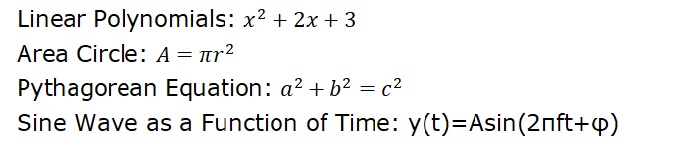
Mathematical Expressions in Matplotlib
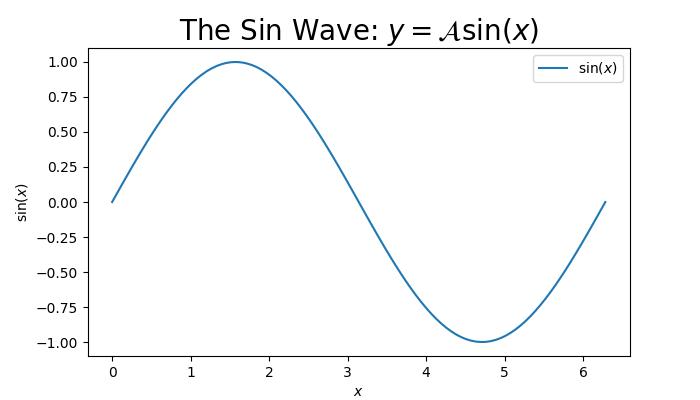
Matplotlib allows users to include mathematical expressions in text elements(text object) to enhance the visual representation of mathematical elements in plots and figures.
The following image shows the inclusion of mathematical expressions in matplotlib plot −
Mathtext in Matplotlib
Matplotlib uses a module called Mathtext to render the math expressions in plots. It is a lightweight TeX expression parser and layout engine to render the math expressions in Matplotlib.
Key Features of Mathtext
Mathtext supports various features such as −
Symbols
Special characters
Subscripts, Superscripts, and Standard Function Names
Fractions and binomials
Radicals
Different fonts and more
The Mathtext expressions should be enclosed in dollar signs ('$') and can include various symbols and commands. The text objects like titles, lables, annotations, and figure text are the common places in Matplotlib where mathematical expressions are included.
Basic Mathematical Text
Basic mathematical text can include binary operation symbols like ‘+’, ‘-’, ‘*’,... to represent various mathematical operations between two elements.
Example
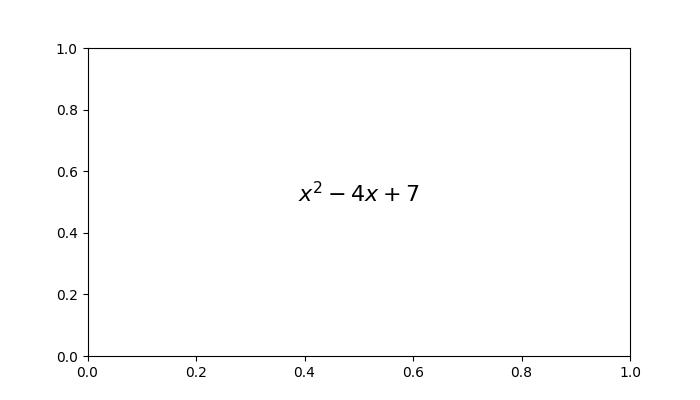
This example demonstrates the inclusion of binary operation symbols like +, − to denote addition, subtraction respectively.
import matplotlib.pyplot as plt

# Create a plot
fig = plt.figure(figsize=(7, 4))

# Displaying basic mathematical text
plt.text(.5, .5, r"$x^2 - 4x + 7$", fontsize=16, ha='center')

# Show the plot
plt.show()
Output
On executing the above code we will get the following output −
Radical, Greek Letters, and Delimiters
Radicals, Greek letters, and delimiters are key components in mathematical expressions.
A radical, denoted by the square root symbol(√), represents the root of a number or expression.
Greek letters, such as α(alpha), β(beta), γ(gamma), and more are the symbols used to represente the standard mathematical notation.
Delimiters, including parentheses, brackets, and braces, are used to group the expressions, while mainting the the proper order of operations in mathematical statements.
Example
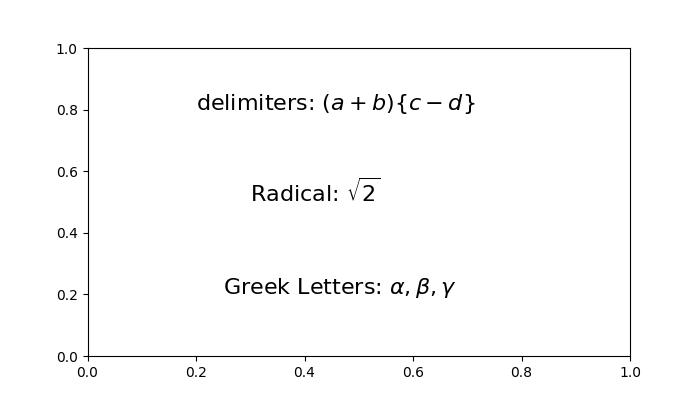
Here is an example of including the mathmetical expression with radicals, greek latters and delimiters.
import matplotlib.pyplot as plt

# Create a figure
fig = plt.figure(figsize=(7, 4))

# Add Greek Letters within the plots
plt.text(0.25, 0.2, r'Greek Letters: $\alpha, \beta, \gamma$', fontsize=16)

# Radicals
plt.text(0.3, 0.5, r'Radical: $\sqrt{2}$', fontsize=16)

# delimiters
plt.text(0.2, 0.8, r'delimiters: $(a + b) \left\{c - d\right\}$', fontsize=16)

# Show the plot
plt.show()
Output
On executing the above code we will get the following output −
Fractions, Binomials, and Stacked Numbers
Fractions are ratio of two numbers, written as one number over another, conveying the division of one quantity by another.
Binomials involve expressions with two terms, often connected by addition or subtraction. In the context of binomial coefficients, binomials can represent combinations or choices within a set.
Stacked numbers refer to the vertical alignment of numerical values, commonly seen in mathematical notations such as exponents or nested expressions.
Example
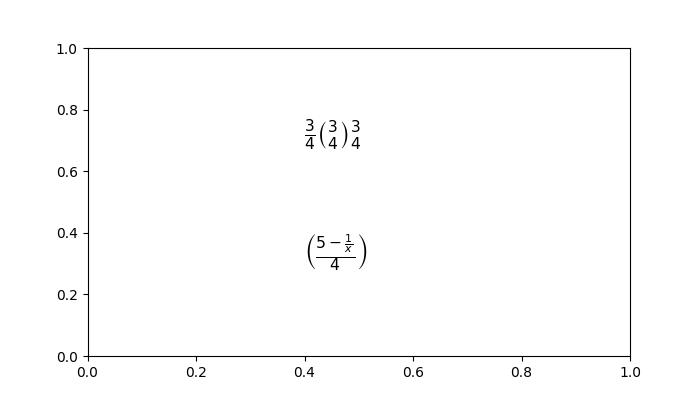
Here is an example of including the mathmetical expreassion with Fractions, Binomials, and Stacked Numbers.
import matplotlib.pyplot as plt

# Create a plot
fig = plt.figure(figsize=(7, 4))

# Fractions, binomials, and stacked numbers
plt.text(0.4, 0.7, r'$\frac{3}{4} \binom{3}{4} \genfrac{}{}{0}{}{3}{4}$', fontsize=16)
plt.text(0.4, 0.3, r'$\left(\frac{5 - \frac{1}{x}}{4}\right)$', fontsize=16)

plt.show()
Output
The above example produces the following output −
Subscripts, Superscripts and Standard Function Names
In mathematical notation, subscripts and superscripts are used to denote indices or exponents, respectively. Whereas, Standard function names are commonly used mathematical functions such as sine, cosine, logarithm, and summation, often denoted by specific symbols or abbreviations.
Example
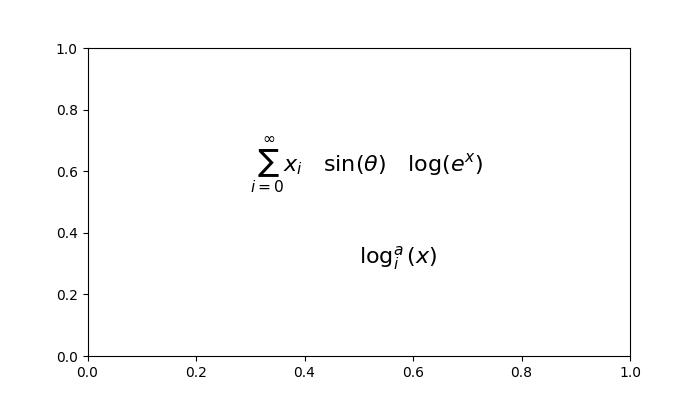
Here is the example of including the mathmetical expression with Subscripts, Superscripts and Standard Function Names.
import matplotlib.pyplot as plt

# Create a figure
fig = plt.figure(figsize=(7, 4))

# Add mathmetical expression with Subscripts, Superscripts and Standard Function Names
plt.text(0.3, 0.6, r'$\sum_{i=0}^\infty x_i \quad \sin(\theta) \quad \log(e^x)$', fontsize=16)

# Subscripts and superscripts
plt.text(0.5, 0.3, r'$\log^a_i (x)$', fontsize=16)

# Show the plot
plt.show()
Output
Here is the output of the above example −
Example
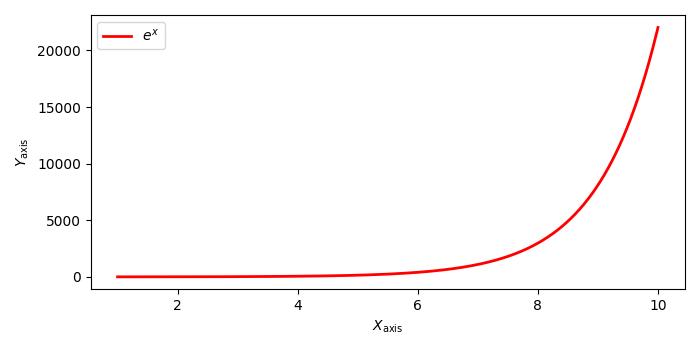
Here is another example that writes text in subscript in the axis labels and the legend.
import numpy as np
import matplotlib.pyplot as plt

# Adjust figure size and autolayout
plt.rcParams["figure.figsize"] = [7.00, 3.50]
plt.rcParams["figure.autolayout"] = True

# Generate data
x = np.linspace(1, 10, 1000)
y = np.exp(x)

# Plot data
plt.plot(x, y, label=r'$e^x$', color="red", linewidth=2)

# Set axis labels
plt.xlabel("$X_{\mathrm{axis}}$")
plt.ylabel("$Y_{\mathrm{axis}}$")

# Set legend
plt.legend(loc='upper left')

# Display plot
plt.show()
Output
On executing the above code you will get the following output −