- Matplotlib Basics
- Matplotlib - Home
- Matplotlib - Introduction
- Matplotlib - Environment Setup
- Matplotlib - Anaconda distribution
- Matplotlib - Jupyter Notebook
- Matplotlib - Pyplot API
- Matplotlib - Simple Plot
- Matplotlib - Text
- Matplotlib - Images
- Matplotlib - Mathematical Expressions
- Matplotlib - Transforms
- Matplotlib - Ticks and Tick Labels
- Matplotlib - Axis Ranges
- Matplotlib - Axis Scales
- Matplotlib - Axis Ticks
- Matplotlib - Formatting Axes
- Matplotlib - Axes Class
- Matplotlib - Twin Axes
- Matplotlib - Figure Class
- Matplotlib - Multiplots
- Matplotlib - Grids
- Matplotlib - Object-oriented Interface
- Matplotlib - PyLab module
- Matplotlib - Subplots() Function
- Matplotlib - Subplot2grid() Function
- Matplotlib - Anchored Artists
- Matplotlib - Manual Contour
- Matplotlib - Coords Report
- Matplotlib - AGG filter
- Matplotlib - Ribbon Box
- Matplotlib - Fill Spiral
- Matplotlib - Findobj Demo
- Matplotlib - Hyperlinks
- Matplotlib - Image Thumbnail
- Matplotlib - Plotting with Keywords
- Matplotlib - Create Logo
- Matplotlib - Multipage PDF
- Matplotlib - Multiprocessing
- Matplotlib - Print Stdout
- Matplotlib - Compound Path
- Matplotlib - Sankey Class
- Matplotlib - MRI with EEG
- Matplotlib - Stylesheets
- Matplotlib - Background Colors
- Matplotlib - Basemap -->
- Matplotlib Widgets
- Matplotlib - Cursor Widget
- Matplotlib - Annotated Cursor
- Matplotlib - Buttons Widget
- Matplotlib - Check Buttons
- Matplotlib - Lasso Selector
- Matplotlib - Menu Widget
- Matplotlib - Mouse Cursor
- Matplotlib - Multicursor
- Matplotlib - Polygon Selector
- Matplotlib - Radio Buttons
- Matplotlib - RangeSlider
- Matplotlib - Rectangle Selector
- Matplotlib - Ellipse Selector
- Matplotlib - Slider Widget
- Matplotlib - Span Selector
- Matplotlib - Textbox
- Matplotlib Plotting
- Matplotlib - Bar Graphs
- Matplotlib - Histogram
- Matplotlib - Pie Chart
- Matplotlib - Scatter Plot
- Matplotlib - Box Plot
- Matplotlib - Violin Plot
- Matplotlib - Contour Plot
- Matplotlib - 3D Plotting
- Matplotlib - 3D Contours
- Matplotlib - 3D Wireframe Plot
- Matplotlib - 3D Surface Plot
- Matplotlib - Quiver Plot
- Matplotlib Useful Resources
- Matplotlib - Quick Guide
- Matplotlib - Useful Resources
- Matplotlib - Discussion
Matplotlib - Anchored Artists
In Matplotlib, an Artist is a fundamental object that represents almost all components of a plot. Whether it's a line, text, axis, or any other graphical element, everything in a Matplotlib plot is an instance of an Artist or is derived from the Artist class.
Anchored Artists are a special type of custom artist that can be anchored to specific positions on a plot. They are useful for adding annotations, arrows, and other custom elements that are anchored to a particular point or region.
See the below example for refence −
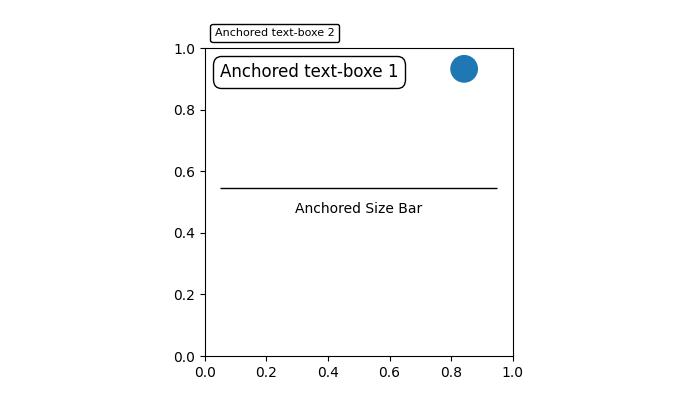
In the above image, you can observe that text boxes, circles, and size bars are anchored at specific positions on the plot.
Anchored Artists in Matplotlib
There are two modules that provides Anchored Artists in Matplotlib, which are −
Matplotlib.offsetbox
Mpl_toolkits.axes_grid1.anchored_artists
The matplotlib.offsetbox module
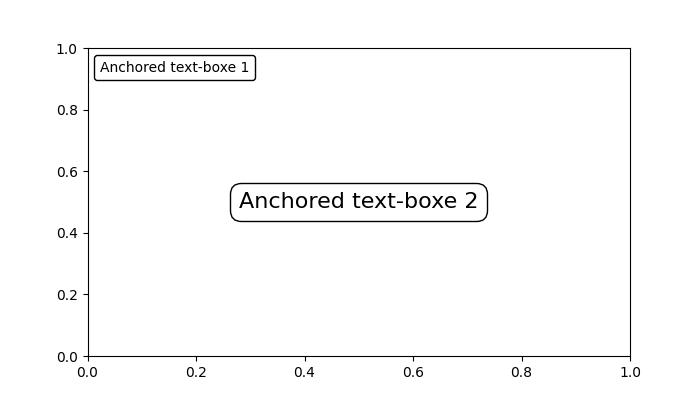
This module provides classes like AnchoredOffsetbox and AnchoredText, allowing you to anchor arbitrary artists or text relative to the parent axes or a specific anchor point. These can be used for more general-purpose annotations and decorations.
Example
Now, let's use the AnchoredText class from the matplotlib.offsetbox module to implement two anchored text boxes at specific location on the plot.
import matplotlib.pyplot as plt
from matplotlib.offsetbox import AnchoredText

# Create a figure and axis
fig, ax = plt.subplots(figsize=(7, 4))

# Anchored Text Box 1
at = AnchoredText("Anchored text-box 1",
   loc='upper left', prop=dict(size=10), frameon=True)
at.patch.set_boxstyle("round,pad=0.,rounding_size=0.2")
ax.add_artist(at)

# Anchored Text Box 2
at2 = AnchoredText("Anchored text-box 2",
   loc='center', prop=dict(size=16), frameon=True,
   bbox_to_anchor=(0.5, 0.5),
   bbox_transform=ax.transAxes)
at2.patch.set_boxstyle("round,pad=0.,rounding_size=0.5")
ax.add_artist(at2)

# Display the plot
plt.show()
Output
On executing the above code we will get the following output −
The mpl_toolkits.axes_grid1.anchored_artists module
This module offers specialized Anchored Artists like AnchoredDirectionArrows, AnchoredAuxTransformBox, AnchoredDrawingArea, and AnchoredSizeBar. Eachof this class is used to different porposes.
Let’s see the usase of the each class −
AnchoredAuxTransformBox − An anchored container with transformed coordinates.
AnchoredDirectionArrows − Draw two perpendicular arrows to indicate directions.
AnchoredDrawingArea − An anchored container with a fixed size and fillable DrawingArea.
AnchoredSizeBar − Draw a horizontal scale bar with a center-aligned label underneath.
Example
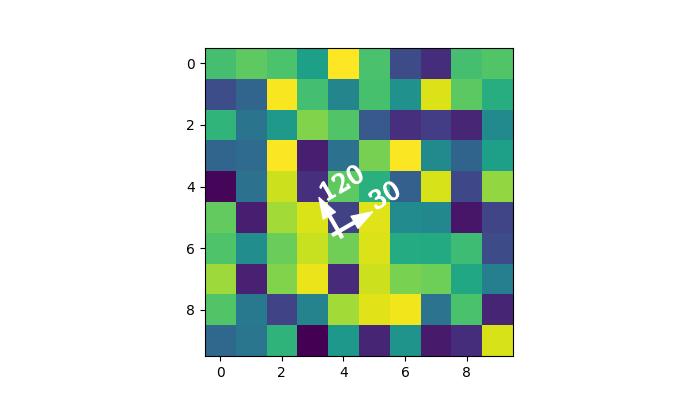
This example demonstrates how to use AnchoredDirectionArrows class to add a visually appealing anchored direction arrow to the Matplotlib plot.
import matplotlib.pyplot as plt
import numpy as np
import matplotlib.font_manager as fm
from mpl_toolkits.axes_grid1.anchored_artists import AnchoredDirectionArrows

np.random.seed(19680801)

fig, ax = plt.subplots(figsize=(7, 4))
ax.imshow(np.random.random((10, 10)))

# Rotated arrow
fontprops = fm.FontProperties(family='serif')

rotated_arrow = AnchoredDirectionArrows(
   ax.transAxes,
   '30', '120',
   loc='center',
   color='w',
   angle=30,
   fontproperties=fontprops
)
ax.add_artist(rotated_arrow)

plt.show()
Output
On executing the above code we will get the following output −
To Continue Learning Please Login