- Matplotlib Tutorial
- Matplotlib - Home
- Matplotlib - Introduction
- Matplotlib - Environment Setup
- Matplotlib - Anaconda distribution
- Matplotlib - Jupyter Notebook
- Matplotlib - Pyplot API
- Matplotlib - Simple Plot
- Matplotlib - PyLab module
- Object-oriented Interface
- Matplotlib - Figure Class
- Matplotlib - Axes Class
- Matplotlib - Multiplots
- Matplotlib - Subplots() Function
- Matplotlib - Subplot2grid() Function
- Matplotlib - Grids
- Matplotlib - Formatting Axes
- Matplotlib - Setting Limits
- Setting Ticks and Tick Labels
- Matplotlib - Twin Axes
- Matplotlib - Bar Plot
- Matplotlib - Histogram
- Matplotlib - Pie Chart
- Matplotlib - Scatter Plot
- Matplotlib - Contour Plot
- Matplotlib - Quiver Plot
- Matplotlib - Box Plot
- Matplotlib - Violin Plot
- Three-dimensional Plotting
- Matplotlib - 3D Contour Plot
- Matplotlib - 3D Wireframe plot
- Matplotlib - 3D Surface plot
- Matplotlib - Working With Text
- Mathematical Expressions
- Matplotlib - Working with Images
- Matplotlib - Transforms
- Matplotlib Useful Resources
- Matplotlib - Quick Guide
- Matplotlib - Useful Resources
- Matplotlib - Discussion
Matplotlib - Object-oriented Interface
While it is easy to quickly generate plots with the matplotlib.pyplot module, the use of object-oriented approach is recommended as it gives more control and customization of your plots. Most of the functions are also available in the matplotlib.axes.Axes class.
The main idea behind using the more formal object-oriented method is to create figure objects and then just call methods or attributes off of that object. This approach helps better in dealing with a canvas that has multiple plots on it.
In object-oriented interface, Pyplot is used only for a few functions such as figure creation, and the user explicitly creates and keeps track of the figure and axes objects. At this level, the user uses Pyplot to create figures, and through those figures, one or more axes objects can be created. These axes objects are then used for most plotting actions.
To begin with, we create a figure instance which provides an empty canvas.
fig = plt.figure()
Now add axes to figure. The add_axes() method requires a list object of 4 elements corresponding to left, bottom, width and height of the figure. Each number must be between 0 and 1 −
ax=fig.add_axes([0,0,1,1])
Set labels for x and y axis as well as title −
ax.set_title("sine wave")
ax.set_xlabel('angle')
ax.set_ylabel('sine')
Invoke the plot() method of the axes object.
ax.plot(x,y)
If you are using Jupyter notebook, the %matplotlib inline directive has to be issued; the otherwistshow() function of pyplot module displays the plot.
Consider executing the following code −
from matplotlib import pyplot as plt
import numpy as np
import math
x = np.arange(0, math.pi*2, 0.05)
y = np.sin(x)
fig = plt.figure()
ax = fig.add_axes([0,0,1,1])
ax.plot(x,y)
ax.set_title("sine wave")
ax.set_xlabel('angle')
ax.set_ylabel('sine')
plt.show()
Output
The above line of code generates the following output −
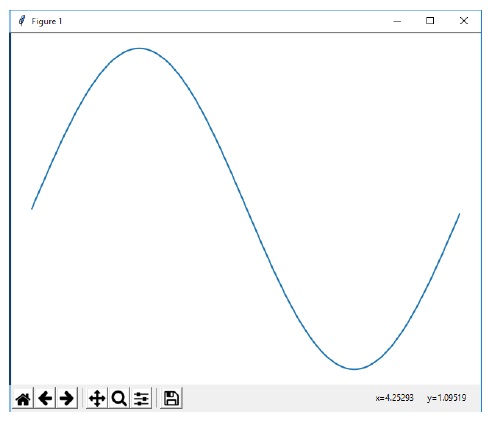
The same code when run in Jupyter notebook shows the output as shown below −
