- Matplotlib Basics
- Matplotlib - Home
- Matplotlib - Introduction
- Matplotlib - Environment Setup
- Matplotlib - Anaconda distribution
- Matplotlib - Jupyter Notebook
- Matplotlib - Pyplot API
- Matplotlib - Simple Plot
- Matplotlib - Text
- Matplotlib - Images
- Matplotlib - Mathematical Expressions
- Matplotlib - Transforms
- Matplotlib - Ticks and Tick Labels
- Matplotlib - Axis Ranges
- Matplotlib - Axis Scales
- Matplotlib - Axis Ticks
- Matplotlib - Formatting Axes
- Matplotlib - Axes Class
- Matplotlib - Twin Axes
- Matplotlib - Figure Class
- Matplotlib - Multiplots
- Matplotlib - Grids
- Matplotlib - Object-oriented Interface
- Matplotlib - PyLab module
- Matplotlib - Subplots() Function
- Matplotlib - Subplot2grid() Function
- Matplotlib - Anchored Artists
- Matplotlib - Manual Contour
- Matplotlib - Coords Report
- Matplotlib - AGG filter
- Matplotlib - Ribbon Box
- Matplotlib - Fill Spiral
- Matplotlib - Findobj Demo
- Matplotlib - Hyperlinks
- Matplotlib - Image Thumbnail
- Matplotlib - Plotting with Keywords
- Matplotlib - Create Logo
- Matplotlib - Multipage PDF
- Matplotlib - Multiprocessing
- Matplotlib - Print Stdout
- Matplotlib - Compound Path
- Matplotlib - Sankey Class
- Matplotlib - MRI with EEG
- Matplotlib - Stylesheets
- Matplotlib - Background Colors
- Matplotlib - Basemap -->
- Matplotlib Widgets
- Matplotlib - Cursor Widget
- Matplotlib - Annotated Cursor
- Matplotlib - Buttons Widget
- Matplotlib - Check Buttons
- Matplotlib - Lasso Selector
- Matplotlib - Menu Widget
- Matplotlib - Mouse Cursor
- Matplotlib - Multicursor
- Matplotlib - Polygon Selector
- Matplotlib - Radio Buttons
- Matplotlib - RangeSlider
- Matplotlib - Rectangle Selector
- Matplotlib - Ellipse Selector
- Matplotlib - Slider Widget
- Matplotlib - Span Selector
- Matplotlib - Textbox
- Matplotlib Plotting
- Matplotlib - Bar Graphs
- Matplotlib - Histogram
- Matplotlib - Pie Chart
- Matplotlib - Scatter Plot
- Matplotlib - Box Plot
- Matplotlib - Violin Plot
- Matplotlib - Contour Plot
- Matplotlib - 3D Plotting
- Matplotlib - 3D Contours
- Matplotlib - 3D Wireframe Plot
- Matplotlib - 3D Surface Plot
- Matplotlib - Quiver Plot
- Matplotlib Useful Resources
- Matplotlib - Quick Guide
- Matplotlib - Useful Resources
- Matplotlib - Discussion
Matplotlib - AGG filter
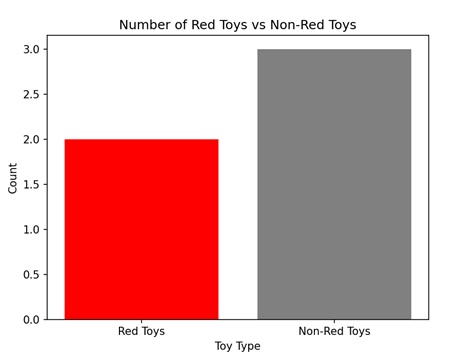
An AGG filter, which stands for "Aggregate Filter", is used to sort through large amounts of data and only show the information that meets certain conditions. Imagine you have a big box of toys, and you only want to see the red ones. The AGG filter would help you quickly find and pick out all the red toys from the box while ignoring the others −
AGG filter in Matplotlib
In Matplotlib, an AGG filter, or Anti-Grain Geometry filter, is used to apply certain transformations to graphical elements, such as lines, markers, or text, before they are displayed on a plot. The AGG filter allows us to modify the appearance of elements in a plot, such as adjusting their transparency, blurring them, or applying other visual effects.
You can use the "FigureCanvasAgg()" function to create an AGG filter in Matplotlib. This function creates a canvas with the AGG filter, allowing you to show plots and images with improved quality and clarity.
Image Smoothing with AGG Filter
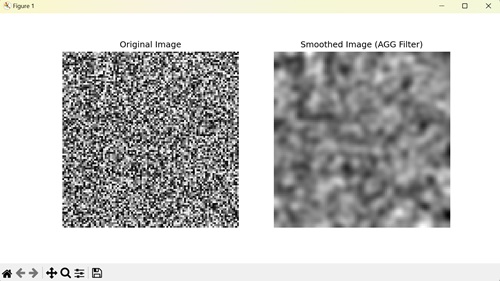
In Matplotlib, image smoothing with the AGG filter is a technique used to blur or soften an image to reduce noise. The AGG filter is one of the options available for image smoothing, and it applies a mathematical algorithm to the image pixels, averaging neighboring pixels to create a smoother appearance. This process helps to remove uneven edges and create a more visually appealing image.
Example
In the following example, we perform image smoothing using the AGG filter. We begin by generating a random noisy image and then apply Gaussian smoothing using the gaussian_filter() function. Afterward, we create a Matplotlib figure with two subplots to display the original and smoothed images side by side −
import matplotlib.pyplot as plt
from matplotlib.backends.backend_agg import FigureCanvasAgg
import numpy as np
from scipy.ndimage import gaussian_filter

# Generating random noisy image
np.random.seed(0)
image = np.random.rand(100, 100)

# Applying Gaussian smoothing to the image
smoothed_image = gaussian_filter(image, sigma=2)

# Creating a figure and plot the original and smoothed images
fig, axs = plt.subplots(1, 2, figsize=(10, 5))

axs[0].imshow(image, cmap='gray')
axs[0].set_title('Original Image')

axs[1].imshow(smoothed_image, cmap='gray')
axs[1].set_title('Smoothed Image (AGG Filter)')

# Hiding the axes
for ax in axs:
   ax.axis('off')

# Saving the figure as an image file
canvas = FigureCanvasAgg(fig)
canvas.print_png('smoothed_image.png')

plt.show()
Output
Following is the output of the above code −
Sharpening Image with AGG Filter
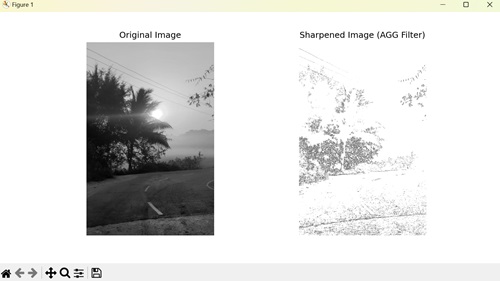
In Matplotlib, sharpening an image with the AGG filter enhances the clarity and detail in an image by increasing the contrast along edges. It involves convolving the image with a sharpening kernel, which generally has positive values at the center surrounded by negative values.
Example
In here, we perform image sharpening using the AGG filter. We start by loading an image, then apply a sharpening filter to enhance the image's edges. This involves defining a sharpening kernel and convolving it with the image using the scipy.ndimage.convolve() function. Finally we display the image −
import matplotlib.pyplot as plt
from matplotlib.backends.backend_agg import FigureCanvasAgg
import numpy as np
from scipy.ndimage import convolve

# Loading an example image
image = plt.imread('sun.jpg')

# Converting to grayscale if image has multiple channels
if len(image.shape) > 2:
   image = image.mean(axis=2)

# Defining a sharpening kernel
kernel = np.array([[-1, -1, -1],
   [-1,  9, -1],
   [-1, -1, -1]])

# Applying the kernel to the image
sharpened_image = np.clip(convolve(image, kernel, mode='constant', cval=0.0), 0, 1)

# Creating a figure and plot the original and sharpened images
fig, axs = plt.subplots(1, 2, figsize=(10, 5))

axs[0].imshow(image, cmap='gray')
axs[0].set_title('Original Image')

axs[1].imshow(sharpened_image, cmap='gray')
axs[1].set_title('Sharpened Image (AGG Filter)')

# Hiding the axes
for ax in axs:
   ax.axis('off')

# Saving the figure as an image file
canvas = FigureCanvasAgg(fig)
canvas.print_png('sharpened_image.png')

plt.show()
Output
On executing the above code we will get the following output −
Embossing Image with AGG Filter
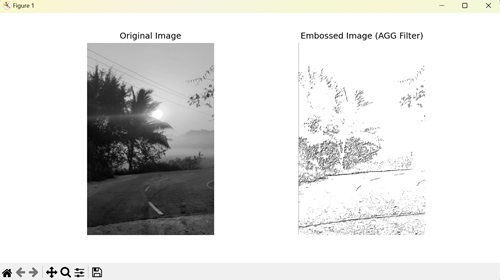
In Matplotlib, embossing an image with the AGG filter emphasizes the edges in an image, giving it a three-dimensional appearance by enhancing the contrast between neighboring pixels. It achieves this effect by convolving the image with an embossing kernel, which generally includes negative and positive values. Embossed images often have a raised or recessed appearance, simulating the effect of stamping or carving.
Example
In the example below, we use AGG filter to emboss an image. We start by loading an example image, then define an embossing kernel, a specific matrix designed to emphasize edges. Applying this kernel to the image using convolution generates the embossed image −
import matplotlib.pyplot as plt
from matplotlib.backends.backend_agg import FigureCanvasAgg
import numpy as np
from scipy.ndimage import convolve

# Loading an example image
image = plt.imread('sun.jpg')

# Converting to grayscale if image has multiple channels
if len(image.shape) > 2:
   image = image.mean(axis=2)

# Defining an embossing kernel
kernel = np.array([[-2, -1, 0],
   [-1,  1, 1],
   [0, 1, 2]])

# Applying the kernel to the image
embossed_image = np.clip(convolve(image, kernel, mode='constant', cval=0.0), 0, 1)

# Creating a figure and plot the original and embossed images
fig, axs = plt.subplots(1, 2, figsize=(10, 5))

axs[0].imshow(image, cmap='gray')
axs[0].set_title('Original Image')

axs[1].imshow(embossed_image, cmap='gray')
axs[1].set_title('Embossed Image (AGG Filter)')

# Hiding the axes
for ax in axs:
   ax.axis('off')

# Saving the figure as an image file
canvas = FigureCanvasAgg(fig)
canvas.print_png('embossed_image.png')

plt.show()
Output
After executing the above code, we get the following output −
To Continue Learning Please Login