- Matplotlib Basics
- Matplotlib - Home
- Matplotlib - Introduction
- Matplotlib - Environment Setup
- Matplotlib - Anaconda distribution
- Matplotlib - Jupyter Notebook
- Matplotlib - Pyplot API
- Matplotlib - Simple Plot
- Matplotlib - Text
- Matplotlib - Images
- Matplotlib - Mathematical Expressions
- Matplotlib - Transforms
- Matplotlib - Ticks and Tick Labels
- Matplotlib - Axis Ranges
- Matplotlib - Axis Scales
- Matplotlib - Axis Ticks
- Matplotlib - Formatting Axes
- Matplotlib - Axes Class
- Matplotlib - Twin Axes
- Matplotlib - Figure Class
- Matplotlib - Multiplots
- Matplotlib - Grids
- Matplotlib - Object-oriented Interface
- Matplotlib - PyLab module
- Matplotlib - Subplots() Function
- Matplotlib - Subplot2grid() Function
- Matplotlib - Anchored Artists
- Matplotlib - Manual Contour
- Matplotlib - Coords Report
- Matplotlib - AGG filter
- Matplotlib - Ribbon Box
- Matplotlib - Fill Spiral
- Matplotlib - Findobj Demo
- Matplotlib - Hyperlinks
- Matplotlib - Image Thumbnail
- Matplotlib - Plotting with Keywords
- Matplotlib - Create Logo
- Matplotlib - Multipage PDF
- Matplotlib - Multiprocessing
- Matplotlib - Print Stdout
- Matplotlib - Compound Path
- Matplotlib - Sankey Class
- Matplotlib - MRI with EEG
- Matplotlib - Stylesheets
- Matplotlib - Background Colors
- Matplotlib - Basemap -->
- Matplotlib Widgets
- Matplotlib - Cursor Widget
- Matplotlib - Annotated Cursor
- Matplotlib - Buttons Widget
- Matplotlib - Check Buttons
- Matplotlib - Lasso Selector
- Matplotlib - Menu Widget
- Matplotlib - Mouse Cursor
- Matplotlib - Multicursor
- Matplotlib - Polygon Selector
- Matplotlib - Radio Buttons
- Matplotlib - RangeSlider
- Matplotlib - Rectangle Selector
- Matplotlib - Ellipse Selector
- Matplotlib - Slider Widget
- Matplotlib - Span Selector
- Matplotlib - Textbox
- Matplotlib Plotting
- Matplotlib - Bar Graphs
- Matplotlib - Histogram
- Matplotlib - Pie Chart
- Matplotlib - Scatter Plot
- Matplotlib - Box Plot
- Matplotlib - Violin Plot
- Matplotlib - Contour Plot
- Matplotlib - 3D Plotting
- Matplotlib - 3D Contours
- Matplotlib - 3D Wireframe Plot
- Matplotlib - 3D Surface Plot
- Matplotlib - Quiver Plot
- Matplotlib Useful Resources
- Matplotlib - Quick Guide
- Matplotlib - Useful Resources
- Matplotlib - Discussion
Matplotlib - Axis Ticks
What are Axis Ticks?
Axis ticks in Matplotlib refer to the markers along the axes that denote specific data values. They aid in understanding the scale of the plot and provide reference points for data visualization. Let's delve into the details of axis ticks −
Key Concepts in Axis ticks
The below are the key concepts available in axis ticks.
Major Ticks − These are the prominent ticks along the axis that represent significant data values.
Minor Ticks − These are the smaller ticks between major ticks which provides more granularity in the scale but usually less prominent.
Customizing Axis Ticks
We can customize the axis ticks on the plot as per the requirement and need. There are few steps to be followed to perform customization.
Setting Ticks
We can set the axis ticks in two ways, one is by manual setting and the other is by automatic adjustment.
Manual Setting
We can set specific tick locations and labels for the axis using plt.xticks() or plt.yticks() functions.
Example
import matplotlib.pyplot as plt
import numpy as np
x = np.linspace(0, 10, 100)
y = np.sin(x)
plt.plot(x, y)
plt.xlabel('X-axis')
plt.ylabel('Y-axis')
plt.title('Plot with Custom Axis Ticks')
# Customize x-axis ticks
plt.xticks([0, 1, 2, 3, 4, 5, 6, 7, 8, 9, 10], ['A', 'B', 'C', 'D', 'E', 'F', 'G', 'H', 'I', 'J', 'K'])
# Customize y-axis ticks and labels
plt.yticks([-1, 0, 1], ['Min', 'Zero', 'Max'])
plt.show()
Output

Automatic Adjustment
In Matplotlib the automatic adjustment of axis ticks involves letting the library determine the positions and labels of ticks based on the data range. This process is handled by default when we create a plot but we can fine-tune the automatic adjustment using various formatting options or by adjusting the locator and formatter settings. Here are some aspects related to automatic adjustment of axis ticks.
Default Automatic Adjustment
In this example Matplotlib automatically adjusts the positions and labels of ticks based on the data range.
Example
import matplotlib.pyplot as plt
# Example data
x = [1, 2, 3, 4, 5]
y = [2, 4, 6, 8, 10]
# Creating a plot (automatic adjustment of ticks)
plt.plot(x, y)
plt.xlabel('X-axis')
plt.ylabel('Y-axis')
plt.title('Automatic Adjustment of Axis Ticks')
plt.show()
Output

Customizing Automatic Adjustment
We can customize the ticks automatically by using few functions available in pyplot. These adjustments can be made to suit the nature of our data and enhance the readability of the plot.
Understanding and leveraging automatic adjustment of axis ticks is crucial for creating clear and informative visualizations in Matplotlib.
Adjusting the Number of Ticks
We can use plt.locator_params(axis='x', nbins=5) to control the number of ticks on the x-axis. Adjust the parameter nbins set to the desired number.
Scientific Notation
To display tick labels in scientific notation we can use the plt.ticklabel_format(style='sci', axis='both', scilimits=(min, max)).
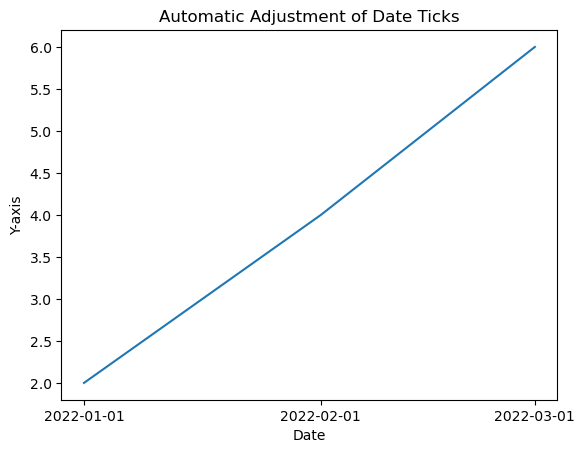
Date Ticks (For Time Series Data)
If we are dealing with date/time data then Matplotlib can automatically format date ticks.
Example
In this example we are applying the customizing automatic adjustment to the axis ticks of the plot.
import matplotlib.dates as mdates
from datetime import datetime
# Example date data
dates = [datetime(2022, 1, 1), datetime(2022, 2, 1), datetime(2022, 3, 1)]
# Creating a plot with automatic adjustment of date ticks
plt.plot(dates, [2, 4, 6])
# Formatting x-axis as date
plt.gca().xaxis.set_major_locator(mdates.MonthLocator())
plt.gca().xaxis.set_major_formatter(mdates.DateFormatter('%Y-%m-%d'))
plt.xlabel('Date')
plt.ylabel('Y-axis')
plt.title('Automatic Adjustment of Date Ticks')
plt.show()
Output
Tick Formatting
We can customize the appearance of tick labels based on font size, color and rotation using fontsize, color and rotation parameters.
Example
import matplotlib.pyplot as plt
# Example data
x = [1, 2, 3, 4, 5]
y = [2, 4, 6, 8, 10]
# Creating a plot (automatic adjustment of ticks)
plt.plot(x, y)
plt.xticks(fontsize=10, color='red', rotation=45)
plt.xlabel('X-axis')
plt.ylabel('Y-axis')
plt.title('Automatic Adjustment of Axis Ticks')
plt.show()
Output

Tick Frequency and Appearance
Setting Tick Frequency
We can adjust the frequency of ticks using plt.locator_params(axis='x', nbins=5) to control the number of ticks displayed.
Example
import matplotlib.pyplot as plt
# Example data
x = [1, 2, 3, 4, 5]
y = [2, 4, 6, 8, 10]
# Creating a plot (automatic adjustment of ticks)
plt.plot(x, y)
plt.locator_params(axis='x', nbins=10)
plt.xlabel('X-axis')
plt.ylabel('Y-axis')
plt.title('Automatic Adjustment of Axis Ticks')
plt.show()
Output

Minor Ticks
We can enable the minor ticks using plt.minorticks_on(). We can customize their appearance with plt.minorticks_on(), plt.minorticks_off() or by specifying their positions.
Example
import matplotlib.pyplot as plt
# Example data
x = [1, 2, 3, 4, 5]
y = [2, 4, 6, 8, 10]
# Creating a plot (automatic adjustment of ticks)
plt.plot(x, y)
plt.minorticks_on()
plt.xlabel('X-axis')
plt.ylabel('Y-axis')
plt.title('Automatic Adjustment of Axis Ticks')
plt.show()
Output

Use Cases
Precision Control − Adjust ticks to provide more precise information about data values.
Enhanced Readability − Customize tick labels and appearance for better readability.
Fine-tuning − Manually set ticks to emphasize specific data points or intervals.
Understanding and customizing axis ticks is crucial for effectively communicating information in plots by allowing us to tailor the presentation of data according to our visualization needs.
Adding extra axis ticks
In this example to add extra ticks we use xticks() function and increase the range of ticks to 1 to 20 from 1 to 10.
Example
import numpy as np
from matplotlib import pyplot as plt
plt.rcParams["figure.figsize"] = [7.50, 3.50]
plt.rcParams["figure.autolayout"] = True
x = np.linspace(1, 10, 100)
y = np.sin(x)
plt.plot(x, y)
plt.xticks(range(1, 20))
plt.show()
Output

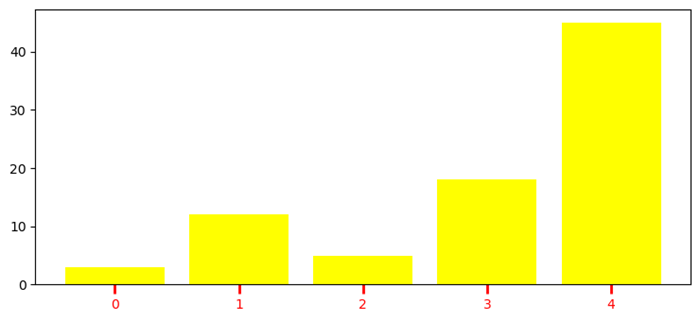
Customize X-axis ticks
In this example to add extra ticks we use xticks() function and increase the range of ticks to 1 to 20 from 1 to 10.
Example
import numpy as np
import matplotlib.pyplot as plt
plt.rcParams["figure.figsize"] = [7.50, 3.50]
plt.rcParams["figure.autolayout"] = True
height = [3, 12, 5, 18, 45]
bars = ('A', 'B', 'C', 'D', 'E')
y_pos = np.arange(len(bars))
plt.bar(y_pos, height, color='yellow')
plt.tick_params(axis='x', colors='red', direction='out', length=7, width=2)
plt.show()
Output
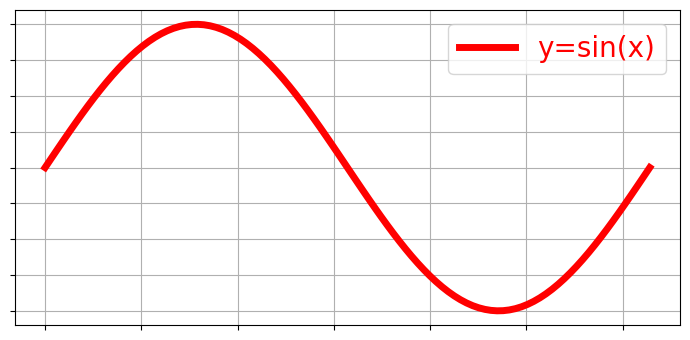
Remove the X-axis ticks while keeping the grids
To remove the X-ticks while keeping the grids we can use the below code as the reference.
Example
import matplotlib.pyplot as plt
import numpy as np
plt.rcParams["figure.figsize"] = [7.00, 3.50]
plt.rcParams["figure.autolayout"] = True
x = np.linspace(0, 2*np.pi, 100)
ax = plt.gca()
ax.plot(x, np.sin(x), c='r', lw=5, label='y=sin(x)')
ax.set_xticklabels([])
ax.set_yticklabels([])
ax.grid(True)
plt.legend(loc="upper right")
plt.show()
Output
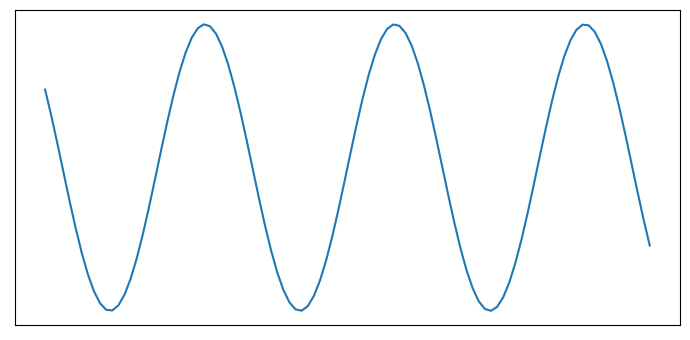
Turn off the ticks and marks
In this example we turn off the ticks and marks of a matplotlib axes we can use set_tick_params() to hide X and Y axes label marks, set_xticks() and set_yticks() to hide X and Y axes tick marks.
Example
import numpy as np
from matplotlib import pyplot as plt
# Set the figure size
plt.rcParams["figure.figsize"] = [7.00, 3.50]
plt.rcParams["figure.autolayout"] = True
# Create x and y data points
x = np.linspace(-10, 10, 100)
y = np.sin(x)
plt.plot(x, y)
ax = plt.gca()
# Hide X and Y axes label marks
ax.xaxis.set_tick_params(labelbottom=False)
ax.yaxis.set_tick_params(labelleft=False)
# Hide X and Y axes tick marks
ax.set_xticks([])
ax.set_yticks([])
plt.show()
Output
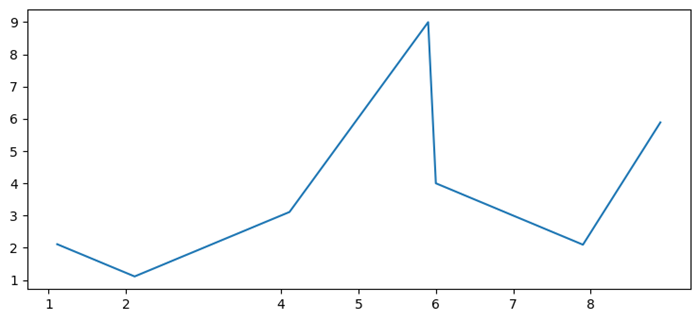
Remove the digits after the decimal point in axis ticks
In this example we use use x.astype(int) function to set the xtick labels only in digits.
Example
import matplotlib.pyplot as plt
import numpy as np
plt.rcParams["figure.figsize"] = [7.50, 3.50]
plt.rcParams["figure.autolayout"] = True
x = np.array([1.110, 2.110, 4.110, 5.901, 6.00, 7.90, 8.90])
y = np.array([2.110, 1.110, 3.110, 9.00, 4.001, 2.095, 5.890])
fig, ax = plt.subplots()
ax.plot(x, y)
ax.set_xticks(x.astype(int))
plt.show()
Output
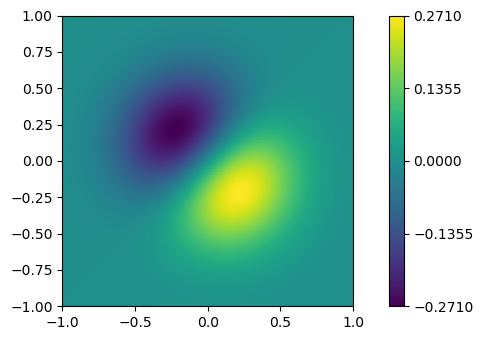
Add Matplotlib Colorbar Ticks
Here in this example we create a colorbar for a ScalarMappable instance, *mappable* with ticks=ticks to add colorbar ticks.
Example
import numpy as np
import matplotlib.pyplot as plt
plt.rcParams["figure.figsize"] = [7.50, 3.50]
plt.rcParams["figure.autolayout"] = True
x, y = np.mgrid[-1:1:100j, -1:1:100j]
z = (x + y) * np.exp(-5.0 * (x ** 2 + y ** 2))
plt.imshow(z, extent=[-1, 1, -1, 1])
ticks = np.linspace(z.min(), z.max(), 5, endpoint=True)
cb = plt.colorbar(ticks=ticks)
plt.show()
Output
Adjusting gridlines and ticks in Matplotlib imshow
In this example we set the xticklabels and yticklabels by using the set_xticklabels and set_yticklabels method.
Example
import numpy as np
from matplotlib import pyplot as plt
plt.rcParams["figure.figsize"] = [7.00, 3.50]
plt.rcParams["figure.autolayout"] = True
data = np.random.rand(9, 9)
plt.imshow(data, interpolation="nearest")
ax = plt.gca()
ax.set_xticks(np.arange(-.5, 9, 1))
ax.set_yticks(np.arange(-.5, 9, 1))
ax.set_xticklabels(np.arange(0, 10, 1))
ax.set_yticklabels(np.arange(0, 10, 1))
ax.grid(color='red', linestyle='-.', linewidth=1)
plt.show()
Output

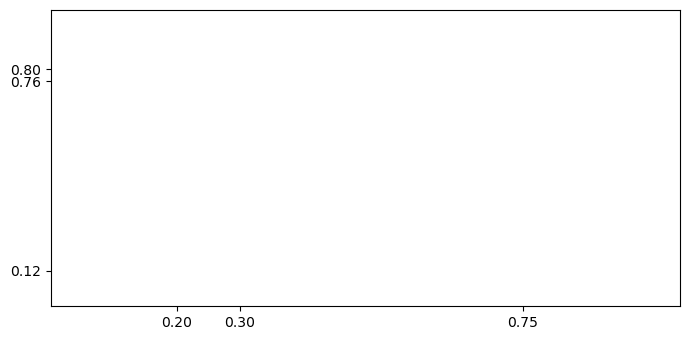
Change the spacing between ticks
In this example we set ticks on a fixed position or change the spacing between ticks in matplotlib
Example
import matplotlib.pyplot as plt
plt.rcParams["figure.figsize"] = [7.00, 3.50]
plt.rcParams["figure.autolayout"] = True
fig, ax = plt.subplots()
xtick_loc = [0.20, 0.75, 0.30]
ytick_loc = [0.12, 0.80, 0.76]
ax.set_xticks(xtick_loc)
ax.set_yticks(ytick_loc)
plt.show()
Output
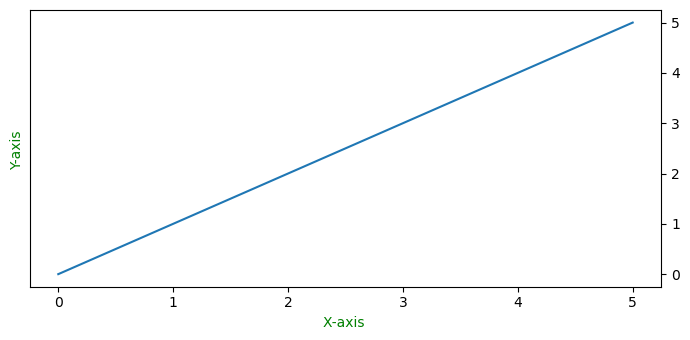
Move the Y-axis ticks from the left side of the plot to the right side
In this example to shift the Y-axis ticks from left to right we use ax.yaxis.tick_right()
Example
from matplotlib import pyplot as plt
import numpy as np
f = plt.figure()
ax = f.add_subplot(111)
ax.yaxis.tick_right()
xpoints = np.array([0, 5])
ypoints = np.array([0, 5])
plt.plot(xpoints, ypoints)
plt.ylabel("Y-axis ")
plt.xlabel("X-axis ")
plt.show()
Output
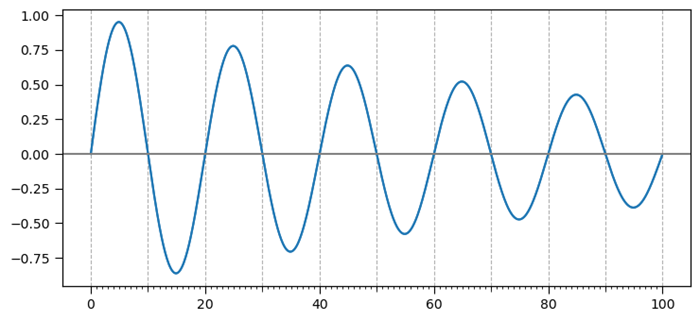
Add third level of ticks
This example is a reference for adding the third level of ticks.
Example
import matplotlib.pyplot as plt
import numpy as np
import matplotlib.ticker
plt.rcParams["figure.figsize"] = [7.50, 3.50]
plt.rcParams["figure.autolayout"] = True
t = np.arange(0.0, 100.0, 0.1)
s = np.sin(0.1 * np.pi * t) * np.exp(-t * 0.01)
fig, ax = plt.subplots()
plt.plot(t, s)
ax1 = ax.twiny()
ax1.plot(t, s)
ax1.xaxis.set_ticks_position('bottom')
majors = np.linspace(0, 100, 6)
minors = np.linspace(0, 100, 11)
thirds = np.linspace(0, 100, 101)
ax.xaxis.set_major_locator(matplotlib.ticker.FixedLocator(majors))
ax.xaxis.set_minor_locator(matplotlib.ticker.FixedLocator(minors))
ax1.xaxis.set_major_locator(matplotlib.ticker.FixedLocator([]))
ax1.xaxis.set_minor_locator(matplotlib.ticker.FixedLocator(thirds))
ax1.tick_params(which='minor', length=2)
ax.tick_params(which='minor', length=4)
ax.tick_params(which='major', length=6)
ax.grid(which='both', axis='x', linestyle='--')
plt.axhline(color='gray')
plt.show()
Output
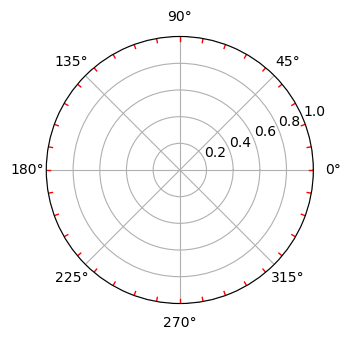
Create minor ticks for a polar plot
This example is a reference for adding the third level of ticks.
Example
import numpy as np
import matplotlib.pyplot as plt
# Set the figure size
plt.rcParams["figure.figsize"] = [7.00, 3.50]
plt.rcParams["figure.autolayout"] = True
# radius and theta for the polar plot
r = np.arange(0, 5, 0.1)
theta = 2 * np.pi * r
# Add a subplot
ax = plt.subplot(111, projection='polar')
tick = [ax.get_rmax(), ax.get_rmax() * 0.97]
# Iterate the points between 0 to 360 with step=10
for t in np.deg2rad(np.arange(0, 360, 10)):
   ax.plot([t, t], tick, lw=1, color="red")
# Display the plot
plt.show()
Output
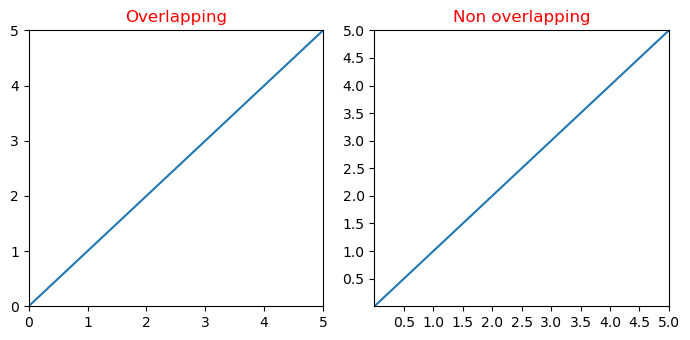
Overlapping Y-axis tick label and X-axis tick label
In this example we reduce the chances of overlapping between x and y tick labels in matplotlib.
Example
import matplotlib.pyplot as plt
from matplotlib.ticker import MaxNLocator
import numpy as np
plt.rcParams["figure.figsize"] = [7.00, 3.50]
plt.rcParams["figure.autolayout"] = True
xs = np.linspace(0, 5, 10)
ys = np.linspace(0, 5, 10)
plt.subplot(121)
plt.margins(x=0, y=0)
plt.plot(xs, ys)
plt.title("Overlapping")
plt.subplot(122)
plt.margins(x=0, y=0)
plt.plot(xs, ys)
plt.title("Non overlapping")
plt.gca().xaxis.set_major_locator(MaxNLocator(prune='lower'))
plt.gca().yaxis.set_major_locator(MaxNLocator(prune='lower'))
plt.show()
Output
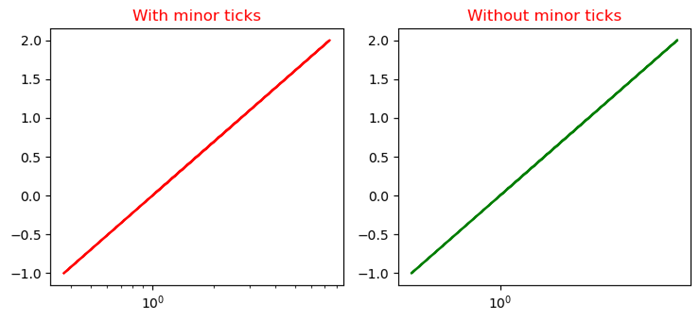
Disable the minor ticks of a log-plot
This example disable the minor ticks of a log plot in matplotlib by using minorticks_off() function.
Example
import numpy as np
from matplotlib import pyplot as plt
plt.rcParams["figure.figsize"] = [7.50, 3.50]
plt.rcParams["figure.autolayout"] = True
x = np.random.randint(-3, 3, 10)
y = np.exp(x)
plt.subplot(121)
plt.plot(y, x, c='red')
plt.xscale('log')
plt.title("With minor ticks")
plt.subplot(122)
plt.plot(y, x, c='green')
plt.xscale('log')
plt.minorticks_off()
plt.title("Without minor ticks")
plt.show()
Output
To Continue Learning Please Login