- Matplotlib Tutorial
- Matplotlib - Home
- Matplotlib - Introduction
- Matplotlib - Environment Setup
- Matplotlib - Anaconda distribution
- Matplotlib - Jupyter Notebook
- Matplotlib - Pyplot API
- Matplotlib - Simple Plot
- Matplotlib - PyLab module
- Object-oriented Interface
- Matplotlib - Figure Class
- Matplotlib - Axes Class
- Matplotlib - Multiplots
- Matplotlib - Subplots() Function
- Matplotlib - Subplot2grid() Function
- Matplotlib - Grids
- Matplotlib - Formatting Axes
- Matplotlib - Setting Limits
- Setting Ticks and Tick Labels
- Matplotlib - Twin Axes
- Matplotlib - Bar Plot
- Matplotlib - Histogram
- Matplotlib - Pie Chart
- Matplotlib - Scatter Plot
- Matplotlib - Contour Plot
- Matplotlib - Quiver Plot
- Matplotlib - Box Plot
- Matplotlib - Violin Plot
- Three-dimensional Plotting
- Matplotlib - 3D Contour Plot
- Matplotlib - 3D Wireframe plot
- Matplotlib - 3D Surface plot
- Matplotlib - Working With Text
- Mathematical Expressions
- Matplotlib - Working with Images
- Matplotlib - Transforms
- Matplotlib Useful Resources
- Matplotlib - Quick Guide
- Matplotlib - Useful Resources
- Matplotlib - Discussion
Matplotlib - Subplot2grid() Function
This function gives more flexibility in creating an axes object at a specific location of the grid. It also allows the axes object to be spanned across multiple rows or columns.
Plt.subplot2grid(shape, location, rowspan, colspan)
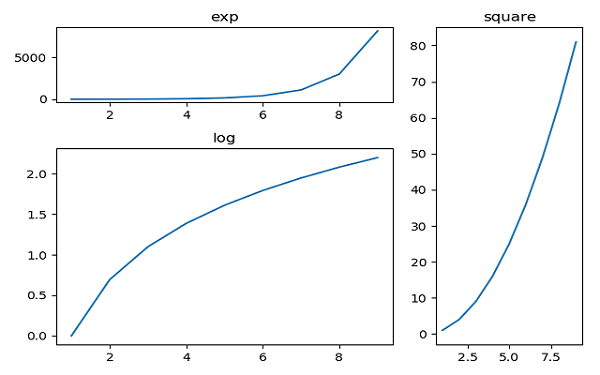
In the following example, a 3X3 grid of the figure object is filled with axes objects of varying sizes in row and column spans, each showing a different plot.
import matplotlib.pyplot as plt
a1 = plt.subplot2grid((3,3),(0,0),colspan = 2)
a2 = plt.subplot2grid((3,3),(0,2), rowspan = 3)
a3 = plt.subplot2grid((3,3),(1,0),rowspan = 2, colspan = 2)
import numpy as np
x = np.arange(1,10)
a2.plot(x, x*x)
a2.set_title('square')
a1.plot(x, np.exp(x))
a1.set_title('exp')
a3.plot(x, np.log(x))
a3.set_title('log')
plt.tight_layout()
plt.show()
Upon execution of the above line code, the following output is generated −
Advertisements