- Matplotlib Basics
- Matplotlib - Home
- Matplotlib - Introduction
- Matplotlib - Environment Setup
- Matplotlib - Anaconda distribution
- Matplotlib - Jupyter Notebook
- Matplotlib - Pyplot API
- Matplotlib - Simple Plot
- Matplotlib - Text
- Matplotlib - Images
- Matplotlib - Mathematical Expressions
- Matplotlib - Transforms
- Matplotlib - Ticks and Tick Labels
- Matplotlib - Axis Ranges
- Matplotlib - Axis Scales
- Matplotlib - Axis Ticks
- Matplotlib - Formatting Axes
- Matplotlib - Axes Class
- Matplotlib - Twin Axes
- Matplotlib - Figure Class
- Matplotlib - Multiplots
- Matplotlib - Grids
- Matplotlib - Object-oriented Interface
- Matplotlib - PyLab module
- Matplotlib - Subplots() Function
- Matplotlib - Subplot2grid() Function
- Matplotlib - Anchored Artists
- Matplotlib - Manual Contour
- Matplotlib - Coords Report
- Matplotlib - AGG filter
- Matplotlib - Ribbon Box
- Matplotlib - Fill Spiral
- Matplotlib - Findobj Demo
- Matplotlib - Hyperlinks
- Matplotlib - Image Thumbnail
- Matplotlib - Plotting with Keywords
- Matplotlib - Create Logo
- Matplotlib - Multipage PDF
- Matplotlib - Multiprocessing
- Matplotlib - Print Stdout
- Matplotlib - Compound Path
- Matplotlib - Sankey Class
- Matplotlib - MRI with EEG
- Matplotlib - Stylesheets
- Matplotlib - Background Colors
- Matplotlib - Basemap -->
- Matplotlib Widgets
- Matplotlib - Cursor Widget
- Matplotlib - Annotated Cursor
- Matplotlib - Buttons Widget
- Matplotlib - Check Buttons
- Matplotlib - Lasso Selector
- Matplotlib - Menu Widget
- Matplotlib - Mouse Cursor
- Matplotlib - Multicursor
- Matplotlib - Polygon Selector
- Matplotlib - Radio Buttons
- Matplotlib - RangeSlider
- Matplotlib - Rectangle Selector
- Matplotlib - Ellipse Selector
- Matplotlib - Slider Widget
- Matplotlib - Span Selector
- Matplotlib - Textbox
- Matplotlib Plotting
- Matplotlib - Bar Graphs
- Matplotlib - Histogram
- Matplotlib - Pie Chart
- Matplotlib - Scatter Plot
- Matplotlib - Box Plot
- Matplotlib - Violin Plot
- Matplotlib - Contour Plot
- Matplotlib - 3D Plotting
- Matplotlib - 3D Contours
- Matplotlib - 3D Wireframe Plot
- Matplotlib - 3D Surface Plot
- Matplotlib - Quiver Plot
- Matplotlib Useful Resources
- Matplotlib - Quick Guide
- Matplotlib - Useful Resources
- Matplotlib - Discussion
Matplotlib - Compound Path
In graphics and design, a "path" is a sequence of points connected by lines or curves. It is like drawing a line from one point to another. "Compound" means made up of multiple parts or elements.
Imagine you have several basic shapes like circles, rectangles, and lines. Individually, these shapes are simple and limited in what they can represent. However, by combining them together in different arrangements and orientations, you can create more complex and interesting shapes. This process of combining simple shapes to create more complex ones is what is referred to as using compound paths.
Compound Path in Matplotlib
A compound path in Matplotlib refers to a combination of multiple simple paths or shapes that are grouped together to form a more complex shape. These simple paths could be lines, curves, polygons, or other basic shapes.
In Matplotlib, you can create compound paths using the "Path" class, which allows you to define custom paths by specifying the vertices and codes that describe the path segments. You can then use these custom paths to draw complex shapes or patterns on your plots.
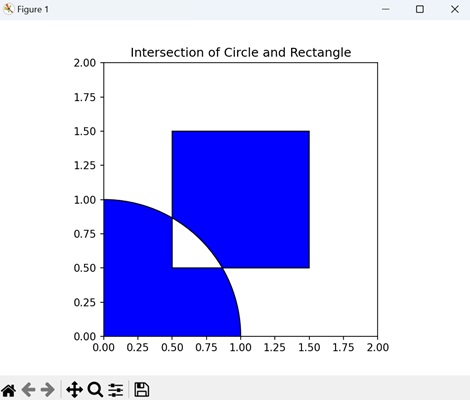
Compound Path: Intersection of Circle and Rectangle
A compound path of the intersection of a circle and a rectangle in Matplotlib refers to creating a single shape that represents the area where the circle and the rectangle overlap or intersect. Instead of treating the circle and the rectangle as separate entities, you combine them together to form a new, more complex shape that captures the common region where they intersect.
In Matplotlib, you can create a compound path of the intersection of a circle and a rectangle by defining the vertices and codes that describe the path segments for each shape. Then, you combine these paths together to form the compound path representing the intersection. Once created, you can use this compound path to draw the intersecting area on your plot.
Example
In the following example, we are creating a compound path representing the intersection of a circle and a rectangle by combining their vertices and codes into a single Path object −
import matplotlib.pyplot as plt
from matplotlib.path import Path
from matplotlib.patches import PathPatch

# Defining the paths for the shapes
circle = Path.unit_circle()
rect = Path([(0.5, 0.5), (0.5, 1.5), (1.5, 1.5), (1.5, 0.5), (0.5, 0.5)], closed=True)

# Combining the paths into a compound path (Intersection)
compound_vertices = circle.vertices.tolist() + rect.vertices.tolist()
compound_codes = circle.codes.tolist() + rect.codes.tolist()
compound_path = Path(compound_vertices, compound_codes)

# Plotting the compound path
fig, ax = plt.subplots()
patch = PathPatch(compound_path, facecolor='blue', edgecolor='black')
ax.add_patch(patch)

# Setting plot limits and aspect ratio
ax.set_xlim(0, 2)
ax.set_ylim(0, 2)
ax.set_aspect('equal')

# Showing the plot
plt.title('Intersection of Circle and Rectangle')
plt.show()
Output
Following is the output of the above code −
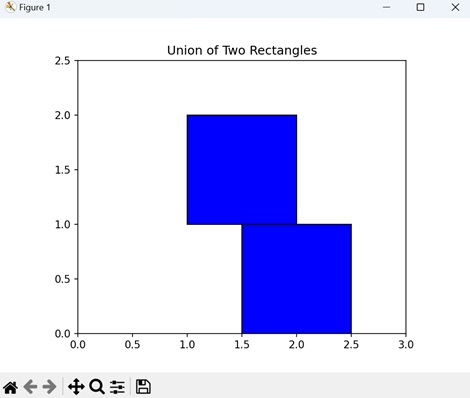
Compound Path of Union of Two Rectangles
A compound path of the union of two rectangles in Matplotlib refers to creating a single shape by combining the areas covered by two separate rectangles. Instead of treating the rectangles as individual shapes, you merge them together to form a new, more complex shape.
In Matplotlib, you can create a compound path of the union of two rectangles by defining the vertices and codes that describe the path segments for each rectangle. Then, you combine these paths together to form the compound path representing the union of the rectangles. Once created, you can use this compound path to draw the combined shape on your plot.
Example
In here, we are creating a compound path representing the union of two rectangles by combining their vertices and codes into a single Path object −
import matplotlib.pyplot as plt
from matplotlib.path import Path
from matplotlib.patches import PathPatch

# Defining the paths for the shapes
# Rectangle 1
path1 = Path([(1, 1), (1, 2), (2, 2), (2, 1), (1, 1)], closed=True)
# Rectangle 2
path2 = Path([(1.5, 0), (1.5, 1), (2.5, 1), (2.5, 0), (1.5, 0)], closed=True)

# Combining the paths into a compound path (Union)
compound_vertices = path1.vertices.tolist() + path2.vertices.tolist()
compound_codes = path1.codes.tolist() + path2.codes.tolist()
compound_path = Path(compound_vertices, compound_codes)

# Plotting the compound path
fig, ax = plt.subplots()
patch = PathPatch(compound_path, facecolor='blue', edgecolor='black')
ax.add_patch(patch)

# Setting plot limits and aspect ratio
ax.set_xlim(0, 3)
ax.set_ylim(0, 2.5)
ax.set_aspect('equal')

# Displaying the plot
plt.title('Union of Two Rectangles')
plt.show()
Output
On executing the above code we will get the following output −
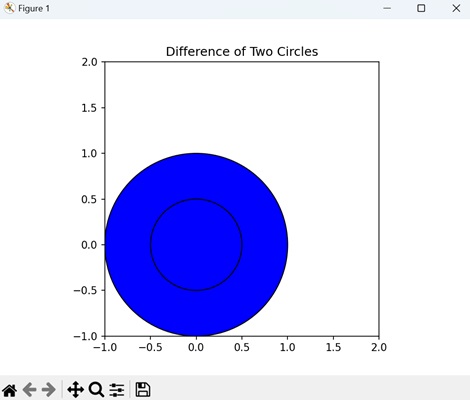
Compound Path: Difference of Two Circles
A compound path of the difference of two circles in Matplotlib refers to creating a single shape that represents the area remaining when one circle is subtracted from another.
In Matplotlib, you can create a compound path of the difference of two circles by defining the vertices and codes that describe the path segments for each circle. Then, you combine these paths together and subtract the path of the smaller circle from the path of the larger circle to form the compound path representing the difference. Once created, you can use this compound path to draw the remaining ring-shaped area on your plot.
Example
Now, we are creating a compound path representing the difference between two circles by combining their vertices and codes into a single Path object −
import matplotlib.pyplot as plt
from matplotlib.path import Path
from matplotlib.patches import PathPatch
import numpy as np

# Defining the paths for the shapes
circle1 = Path.unit_circle()
circle2 = Path.unit_circle().transformed(plt.matplotlib.transforms.Affine2D().scale(0.5))

# Combining the paths into a compound path (Difference)
compound_vertices = np.concatenate([circle1.vertices, circle2.vertices])
compound_codes = np.concatenate([circle1.codes, circle2.codes])
compound_path = Path(compound_vertices, compound_codes)

# Plotting the compound path
fig, ax = plt.subplots()
patch = PathPatch(compound_path, facecolor='blue', edgecolor='black')
ax.add_patch(patch)

# Setting plot limits and aspect ratio
ax.set_xlim(-1, 2)
ax.set_ylim(-1, 2)
ax.set_aspect('equal')

# Displaying the plot
plt.title('Difference of Two Circles')
plt.show()
Output
After executing the above code, we get the following output −
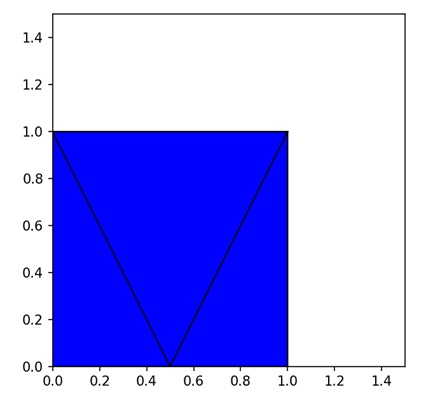
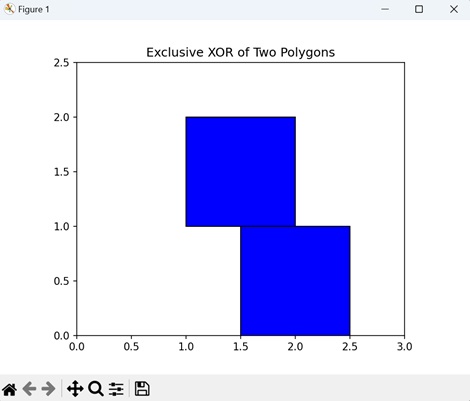
Compound Path: Exclusive XOR of Two Polygons
A compound path of the exclusive XOR (exclusive OR) of two polygons in Matplotlib represents a combination of the two polygons where only the areas that do not overlap are retained. In other words, it shows the regions that belong exclusively to one of the polygons, but not to both.
In Matplotlib, you can create a compound path of the exclusive XOR of two polygons by defining the vertices and codes that describe the path segments for each polygon. Then, you combine these paths together and apply the exclusive XOR operation to determine the regions that belong exclusively to one polygon or the other. The resulting compound path represents these non-overlapping areas, which you can use to draw on your plot.
Example
In this example, we are creating a compound path representing the exclusive XOR operation on two polygons by combining their vertices and codes into a single Path object −
import matplotlib.pyplot as plt
from matplotlib.path import Path
from matplotlib.patches import PathPatch

# Defining the paths for the shapes
poly1 = Path([(1, 1), (1, 2), (2, 2), (2, 1), (1, 1)], closed=True)  # Rectangle
poly2 = Path([(1.5, 0), (1.5, 1), (2.5, 1), (2.5, 0), (1.5, 0)], closed=True)  # Triangle

# Combining the paths into a compound path (Exclusive XOR)
compound_vertices = poly1.vertices.tolist() + poly2.vertices.tolist()
compound_codes = poly1.codes.tolist() + poly2.codes.tolist()
compound_path = Path(compound_vertices, compound_codes)

# Plotting the compound path
fig, ax = plt.subplots()
patch = PathPatch(compound_path, facecolor='blue', edgecolor='black')
ax.add_patch(patch)

# Setting plot limits and aspect ratio
ax.set_xlim(0, 3)
ax.set_ylim(0, 2.5)
ax.set_aspect('equal')

# Displaying the plot
plt.title('Exclusive XOR of Two Polygons')
plt.show()
Output
On executing the above code we will get the following output −
To Continue Learning Please Login