- Matplotlib Tutorial
- Matplotlib - Home
- Matplotlib - Introduction
- Matplotlib - Environment Setup
- Matplotlib - Anaconda distribution
- Matplotlib - Jupyter Notebook
- Matplotlib - Pyplot API
- Matplotlib - Simple Plot
- Matplotlib - PyLab module
- Object-oriented Interface
- Matplotlib - Figure Class
- Matplotlib - Axes Class
- Matplotlib - Multiplots
- Matplotlib - Subplots() Function
- Matplotlib - Subplot2grid() Function
- Matplotlib - Grids
- Matplotlib - Formatting Axes
- Matplotlib - Setting Limits
- Setting Ticks and Tick Labels
- Matplotlib - Twin Axes
- Matplotlib - Bar Plot
- Matplotlib - Histogram
- Matplotlib - Pie Chart
- Matplotlib - Scatter Plot
- Matplotlib - Contour Plot
- Matplotlib - Quiver Plot
- Matplotlib - Box Plot
- Matplotlib - Violin Plot
- Three-dimensional Plotting
- Matplotlib - 3D Contour Plot
- Matplotlib - 3D Wireframe plot
- Matplotlib - 3D Surface plot
- Matplotlib - Working With Text
- Mathematical Expressions
- Matplotlib - Working with Images
- Matplotlib - Transforms
- Matplotlib Useful Resources
- Matplotlib - Quick Guide
- Matplotlib - Useful Resources
- Matplotlib - Discussion
Matplotlib - Images
What are Images in Matplotlib?
In Matplotlib library displaying and manipulating images involves using the imshow() function. This function visualizes 2D arrays or images. This function is particularly useful for showing images in various formats such as arrays representing pixel values or actual image files.
Images in Matplotlib provide a way to visualize gridded data, facilitating the interpretation and analysis of information represented in 2D arrays. This capability is crucial for various scientific, engineering and machine learning applications that deal with image data.
Use Cases for Images in Matplotlib
The following are the use cases of Images in Matplotlib library.
Visualizing Gridded Data
The matplotlib library can be used for displaying scientific data such as heatmaps, terrain maps, satellite images etc.
Image Processing
Analyzing and manipulating image data in applications such as computer vision or image recognition.
Artificial Intelligence and Machine Learning
Handling and processing image data in training and evaluation of models.
Loading and Displaying Images
To load and display an image using Matplotlib library we can use the following lines of code.
Example
import matplotlib.pyplot as plt
import matplotlib.image as mpimg

# Load the image
img = mpimg.imread('Images/flowers.jpg')  # Load image file

# Display the image
plt.imshow(img)
plt.axis('off')  # Turn off axis labels and ticks (optional)
plt.show()
Key Points of the above code
matplotlib.image.imread() − Loads an image file and returns it as an array. The file path ('image_path') should be specified.
plt.imshow() − Displays the image represented by the array.
plt.axis('off') − Turns off axis labels and ticks, which is optional for purely displaying the image without axes.
Output

Customizing Image Display
We can customize the image as per the requirement by thebelow mentioned functions.
Colormap − We can apply a colormap to enhance image visualization by specifying the cmap parameter in imshow().
Colorbar − To add a colorbar indicating the intensity mapping we can use plt.colorbar() after imshow().
Example
import matplotlib.pyplot as plt
import matplotlib.image as mpimg

# Load the image
img = mpimg.imread('Images/flowers.jpg')  # Load image file

# Display the image
plt.imshow(img, cmap = 'Oranges')
plt.colorbar()

# Turn on axis labels and ticks (optional)
plt.axis('on')
plt.show()
Output
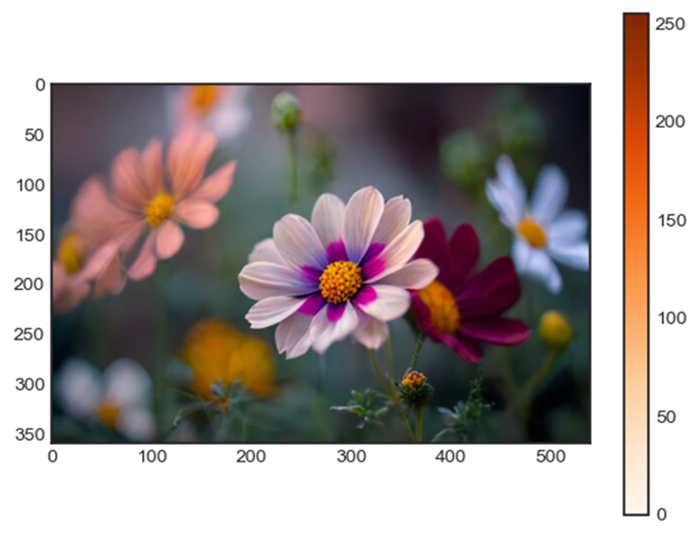
Image Manipulation
We can perform manipulation for our images by using the below mentioned functions.
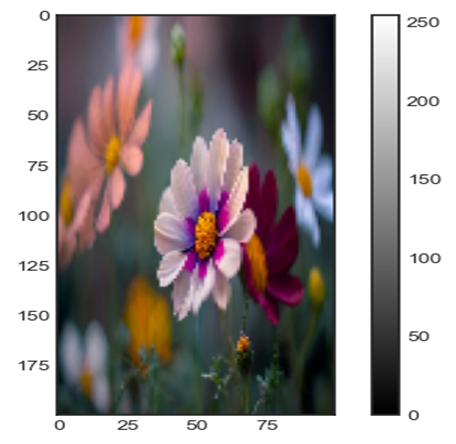
Cropping − Select a specific portion of the image by slicing the array before passing it to imshow().
Resizing − Use various image processing libraries such as Pillow, OpenCV to resize images before displaying them.
Example
In this example we are manipulating the image and displaying the image by using the above mentioned functions.
import matplotlib.pyplot as plt
import matplotlib.image as mpimg
import cv2

# Load the image
img = mpimg.imread('Images/flowers.jpg')

# Display the image with grayscale colormap and colorbar
plt.imshow(img, cmap='gray')
plt.colorbar()

# Display only a portion of the image (cropping)
plt.imshow(img[100:300, 200:400])

# Display a resized version of the image
resized_img = cv2.resize(img, (new_width, new_height))
plt.imshow(resized_img)
plt.show()
Output
Remember Matplotlib's imshow() is suitable for basic image display and visualization. For more advanced image processing tasks such as resizing, filtering, etc. using dedicated image processing libraries like OpenCV or Pillow is recommended.