- QlikView - Home
- QlikView - Overview
- QlikView - Desktop Installation
- QlikView - Architecture
- QlikView - Navigation
- QlikView - Excel file
- QlikView - Delimited file
- QlikView - XML file
- QlikView - Web file
- QlikView - Database
- QlikView - Inline Data
- QlikView - Resident Load
- QlikView - Preceding Load
- QlikView - Incremental Load
- QlikView - Data - files(QVD)
- QlikView Report Interface
- QlikView - Sheet and Objects
- QlikView - Scripting
- Qlikview - Functions
- QlikView - IntervalMatch
- QlikView - Aggregate Functions
- QlikView - Match Function
- QlikView - Rank Function
- QlikView - Peek Function
- QlikView - RangeSum Function
- QlikView - Documents
- QlikView - List Box
- QlikView - Multi Box
- QlikView - Text Object
- QlikView - Bar Chart
- QlikView - Pie Chart
- QlikView - Dashboard
- QlikView Data Transformation
- QlikView - Transformation Wizard
- QlikView - Fill Function
- QlikView - Column Manipulation
- QlikView - Rotating Tables
- QlikView Data Model
- QlikView - Dimensions & measures
- QlikView - Star Schema
- QlikView - Synthetic Key
- QlikView - Generating Data
- QlikView Data Analysis
- QlikView - Cross Tables
- QlikView - Straight Tables
- QlikView - Pivot Tables
- QlikView - Set Analysis
- QlikView - Joins
- QlikView - Keeps
- QlikView - Concatenation
- QlikView - Master Calendar
- QlikView - Mapping Tables
- QlikView - Circular Reference
- Qlikview Useful Resources
- Qlikview - Questions/Answers
- Qlikview - Quick Guide
- Qlikview - Useful Resources
- Qlikview - Discussion
QlikView - Set Analysis
QlikView's Set Analysis feature is used to segregate the data in different sheet objects into many sets and keeps the values unchanged in some of them. In simpler terms, it creates an option to not associate some sheet objects with others while the default behavior is all sheet objects get associated with each other. This helps in filtering the data in one sheet object and seeing the corresponding result in others, while the sheet object chosen as a different set displays values as per its own filters.
Input Data
Let us consider the following input data, which represents the sales figure of different product lines and product categories.
Product_Line,Product_category,Month,Value
Arts & Entertainment,Hobbies & Creative Arts,Jan,5201
Arts & Entertainment,Paintings,Feb,8451
Arts & Entertainment,Musical Instruments,Jan,1245
Baby & Toddler,Diapering,Mar,1247
Baby & Toddler,Toys,Dec,257
Apparel & Accessories,Clothing,Feb,574
Apparel & Accessories,Costumes & Accessories,Apr,1204
Arts & Entertainment,Musical Instruments,Apr,3625
Baby & Toddler,Diapering,Apr,1281
Apparel & Accessories,Clothing,Jul,2594
Arts & Entertainment,Paintings,Sep,6531
Baby & Toddler,Toys,May,7421
Apparel & Accessories,Clothing,Aug,2541
Arts & Entertainment,Paintings,Oct,2658
Arts & Entertainment,Musical Instruments,Mar,1185
Baby & Toddler,Diapering,Jun,1209
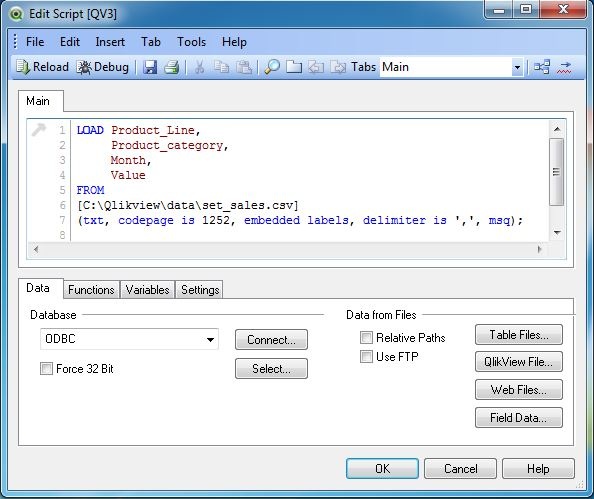
Load Script
The above data is loaded to QlikView memory by using the script editor. Open the Script editor from the File menu or press Control+E. Choose the "Table Files" option from the "Data from Files" tab and browse for the file containing the above data. A screen appears as shown below.
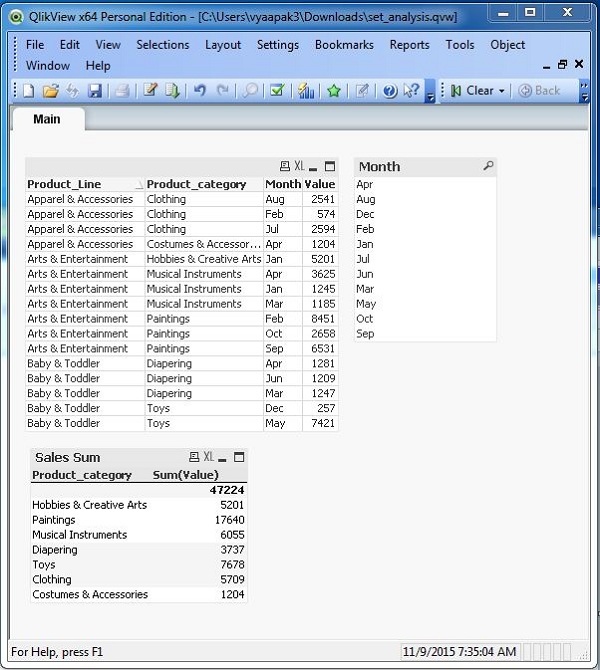
Create Table Box
Choose all the fields available to create a table box using the menu option Layout → New Sheet Objects → Table Box and a list box containing the months field using the menu option Layout → New Sheet Objects → List Box. Also, create a straight table chart showing the total sales under each product category.
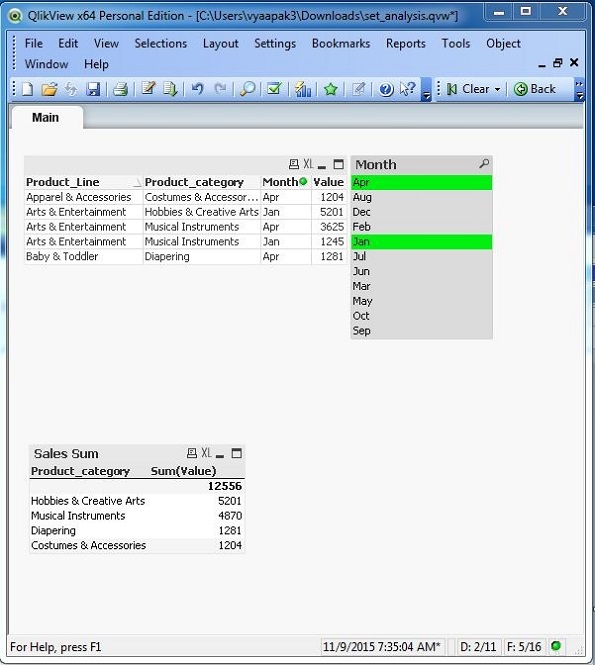
Data Association
Now we can observe the association between these three sheet objects by selecting some values in one of them. Let us select the month Apr and Jan from the Month list Box. We can see the change in values in the Table Box and chart showing the related values.
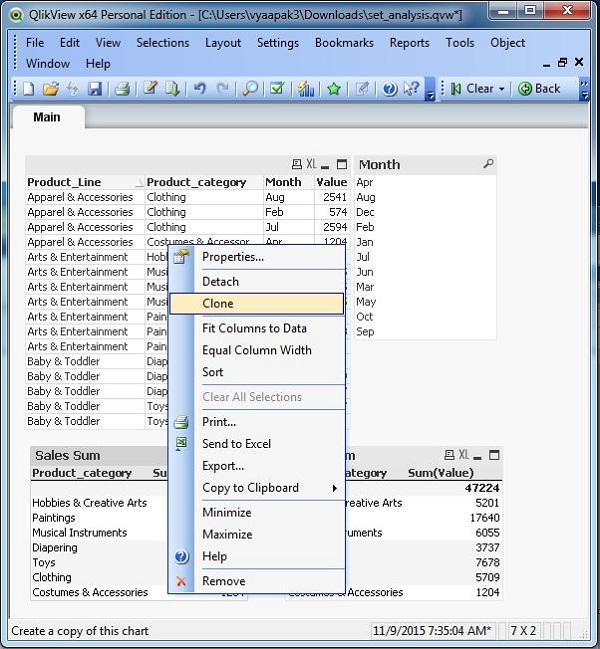
Clone Object
Next, we clone the sales sum chart to produce a new set of data not associated with other sheet objects. Right click on the chart Sales Sum and click on the option Clone as shown below. Another copy of the same chart appears in the QlikView document.
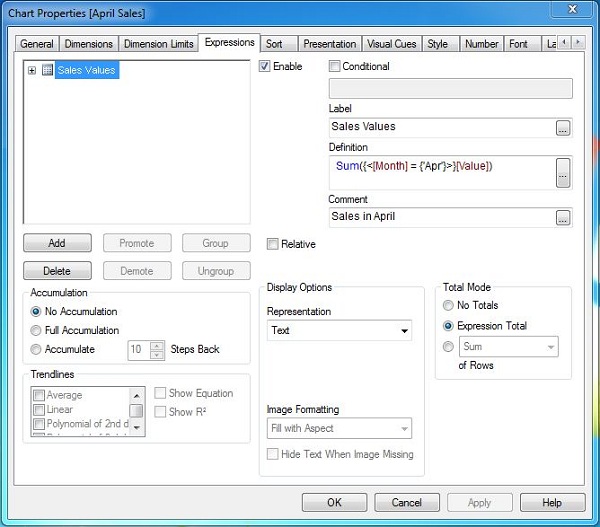
Set Expression
Next, we choose the second copy of the chart Sales Sum and right click it to get the chart properties. We create an expression called Sales values writing the formula under the Definition tab as shown below.
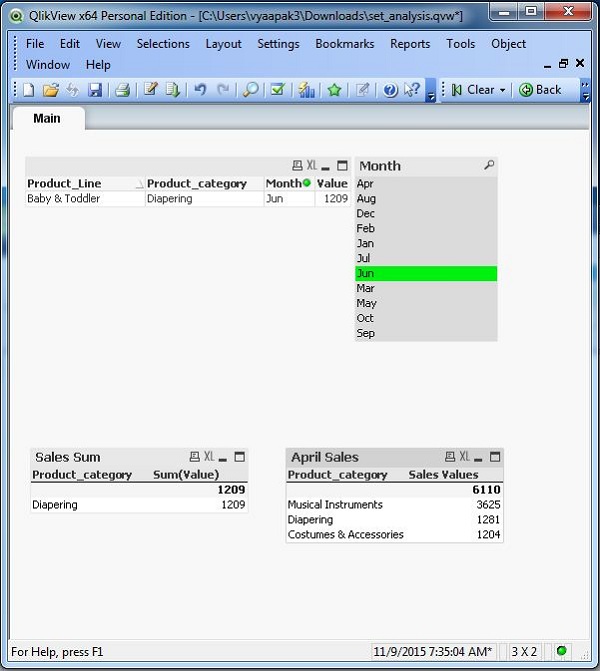
Applying Set Analysis
On completing the above given steps, we find that when we select the month June we get the associated values in the Table Box and Sales Sum chart. However, the April sales does not change as it is based on the data from the set expression.