- QlikView - Home
- QlikView - Overview
- QlikView - Desktop Installation
- QlikView - Architecture
- QlikView - Navigation
- QlikView - Excel file
- QlikView - Delimited file
- QlikView - XML file
- QlikView - Web file
- QlikView - Database
- QlikView - Inline Data
- QlikView - Resident Load
- QlikView - Preceding Load
- QlikView - Incremental Load
- QlikView - Data - files(QVD)
- QlikView Report Interface
- QlikView - Sheet and Objects
- QlikView - Scripting
- Qlikview - Functions
- QlikView - IntervalMatch
- QlikView - Aggregate Functions
- QlikView - Match Function
- QlikView - Rank Function
- QlikView - Peek Function
- QlikView - RangeSum Function
- QlikView - Documents
- QlikView - List Box
- QlikView - Multi Box
- QlikView - Text Object
- QlikView - Bar Chart
- QlikView - Pie Chart
- QlikView - Dashboard
- QlikView Data Transformation
- QlikView - Transformation Wizard
- QlikView - Fill Function
- QlikView - Column Manipulation
- QlikView - Rotating Tables
- QlikView Data Model
- QlikView - Dimensions & measures
- QlikView - Star Schema
- QlikView - Synthetic Key
- QlikView - Generating Data
- QlikView Data Analysis
- QlikView - Cross Tables
- QlikView - Straight Tables
- QlikView - Pivot Tables
- QlikView - Set Analysis
- QlikView - Joins
- QlikView - Keeps
- QlikView - Concatenation
- QlikView - Master Calendar
- QlikView - Mapping Tables
- QlikView - Circular Reference
- Qlikview Useful Resources
- Qlikview - Questions/Answers
- Qlikview - Quick Guide
- Qlikview - Useful Resources
- Qlikview - Discussion
QlikView - Dimensions and Measures
Dimensions and Measures are fundamental entities, which are always used in data analysis. For example, consider the result of the analysis, what is the percentage change in volume of sales for each quarter? In this case, each quarter represents the Dimensions, which is the name of the quarter. The percentage change in volume represents the Measures, which is a calculation with respect to each value in the dimension. Below are some widely accepted definition of these two terms.
- Dimension − It is a descriptive field in the data set which represents few distinct values. Examples − Month, Year, Product ID etc.
- Measures − It is a numeric field on which some calculations are performed for each distinct value of dimension.
Input Data
Let us consider the following input data, which represents the sales volume and Revenue of different product lines and product categories in different regions. Save the data into a .csv file.
ProductID,ProductCategory,Region,SalesVolume, Revenue
1,Outdoor Recreation,Europe,457,25841
2,Clothing,Europe,125,54281
3,Costumes & Accessories,South Asia,781,54872
4,Athletics,South Asia,839,87361
5,Personal Care,Australia,473,15425
6,Arts & Entertainment,North AMerica,625,84151
7,Hardware,South America,772,45812
Load Script
The above data is loaded to the QlikView memory by using the script editor. Open the Script editor from the File menu or press Control+E. Choose the Table Files option from the Data from Files tab and browse for the file containing the above data. Click OK and press Control+R to load the data into the QlikView's memory
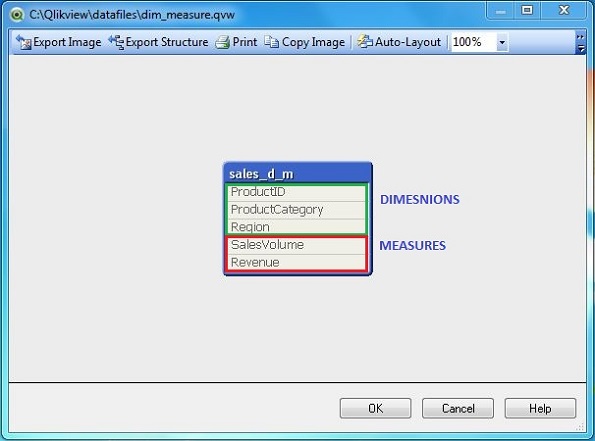
Table Structure
We can see the structure of the table by following the menu File → Table Viewer or pressing Control+T. The following screen comes up in which we have marked the dimensions inside a green box and the measures inside a red box.
Using Dimensions and Measures
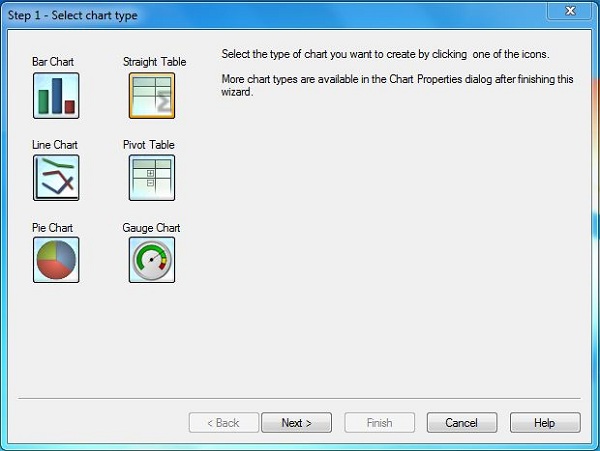
Let us create a straight table chart showing the calculation using above dimensions and measures. Click on the Quick Chart Wizard as shown below.
Next, click on the Straight Table option. Click Next.
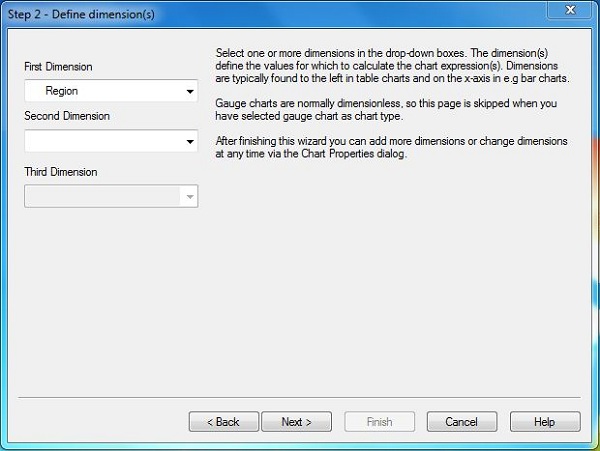
Choose Dimensions
In this screen, we choose Region as the dimension as we want to select the total revenue for each region.
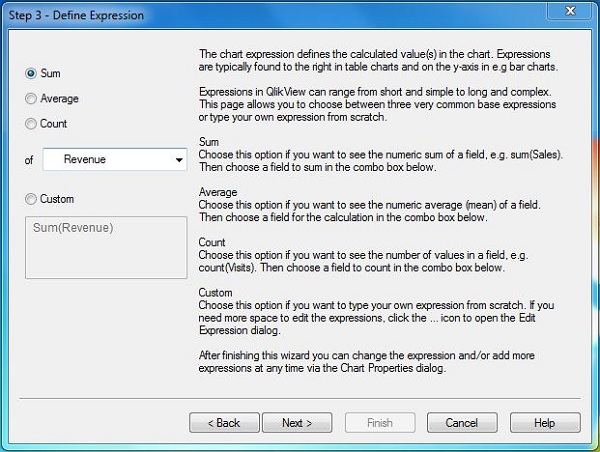
Choose Measure
The Next screen prompts for applying the calculation on a measure field. We choose to apply Sum on the field Revenue.
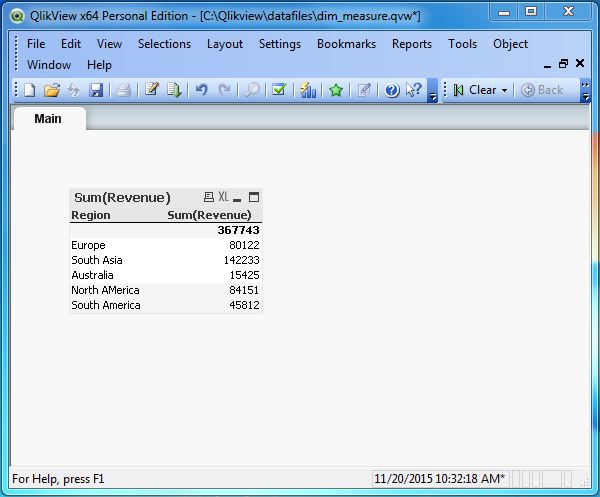
Final chart
On completing the above steps, we get the final chart which shows the total revenue(Measure) for each region(Dimension).